28 Maps
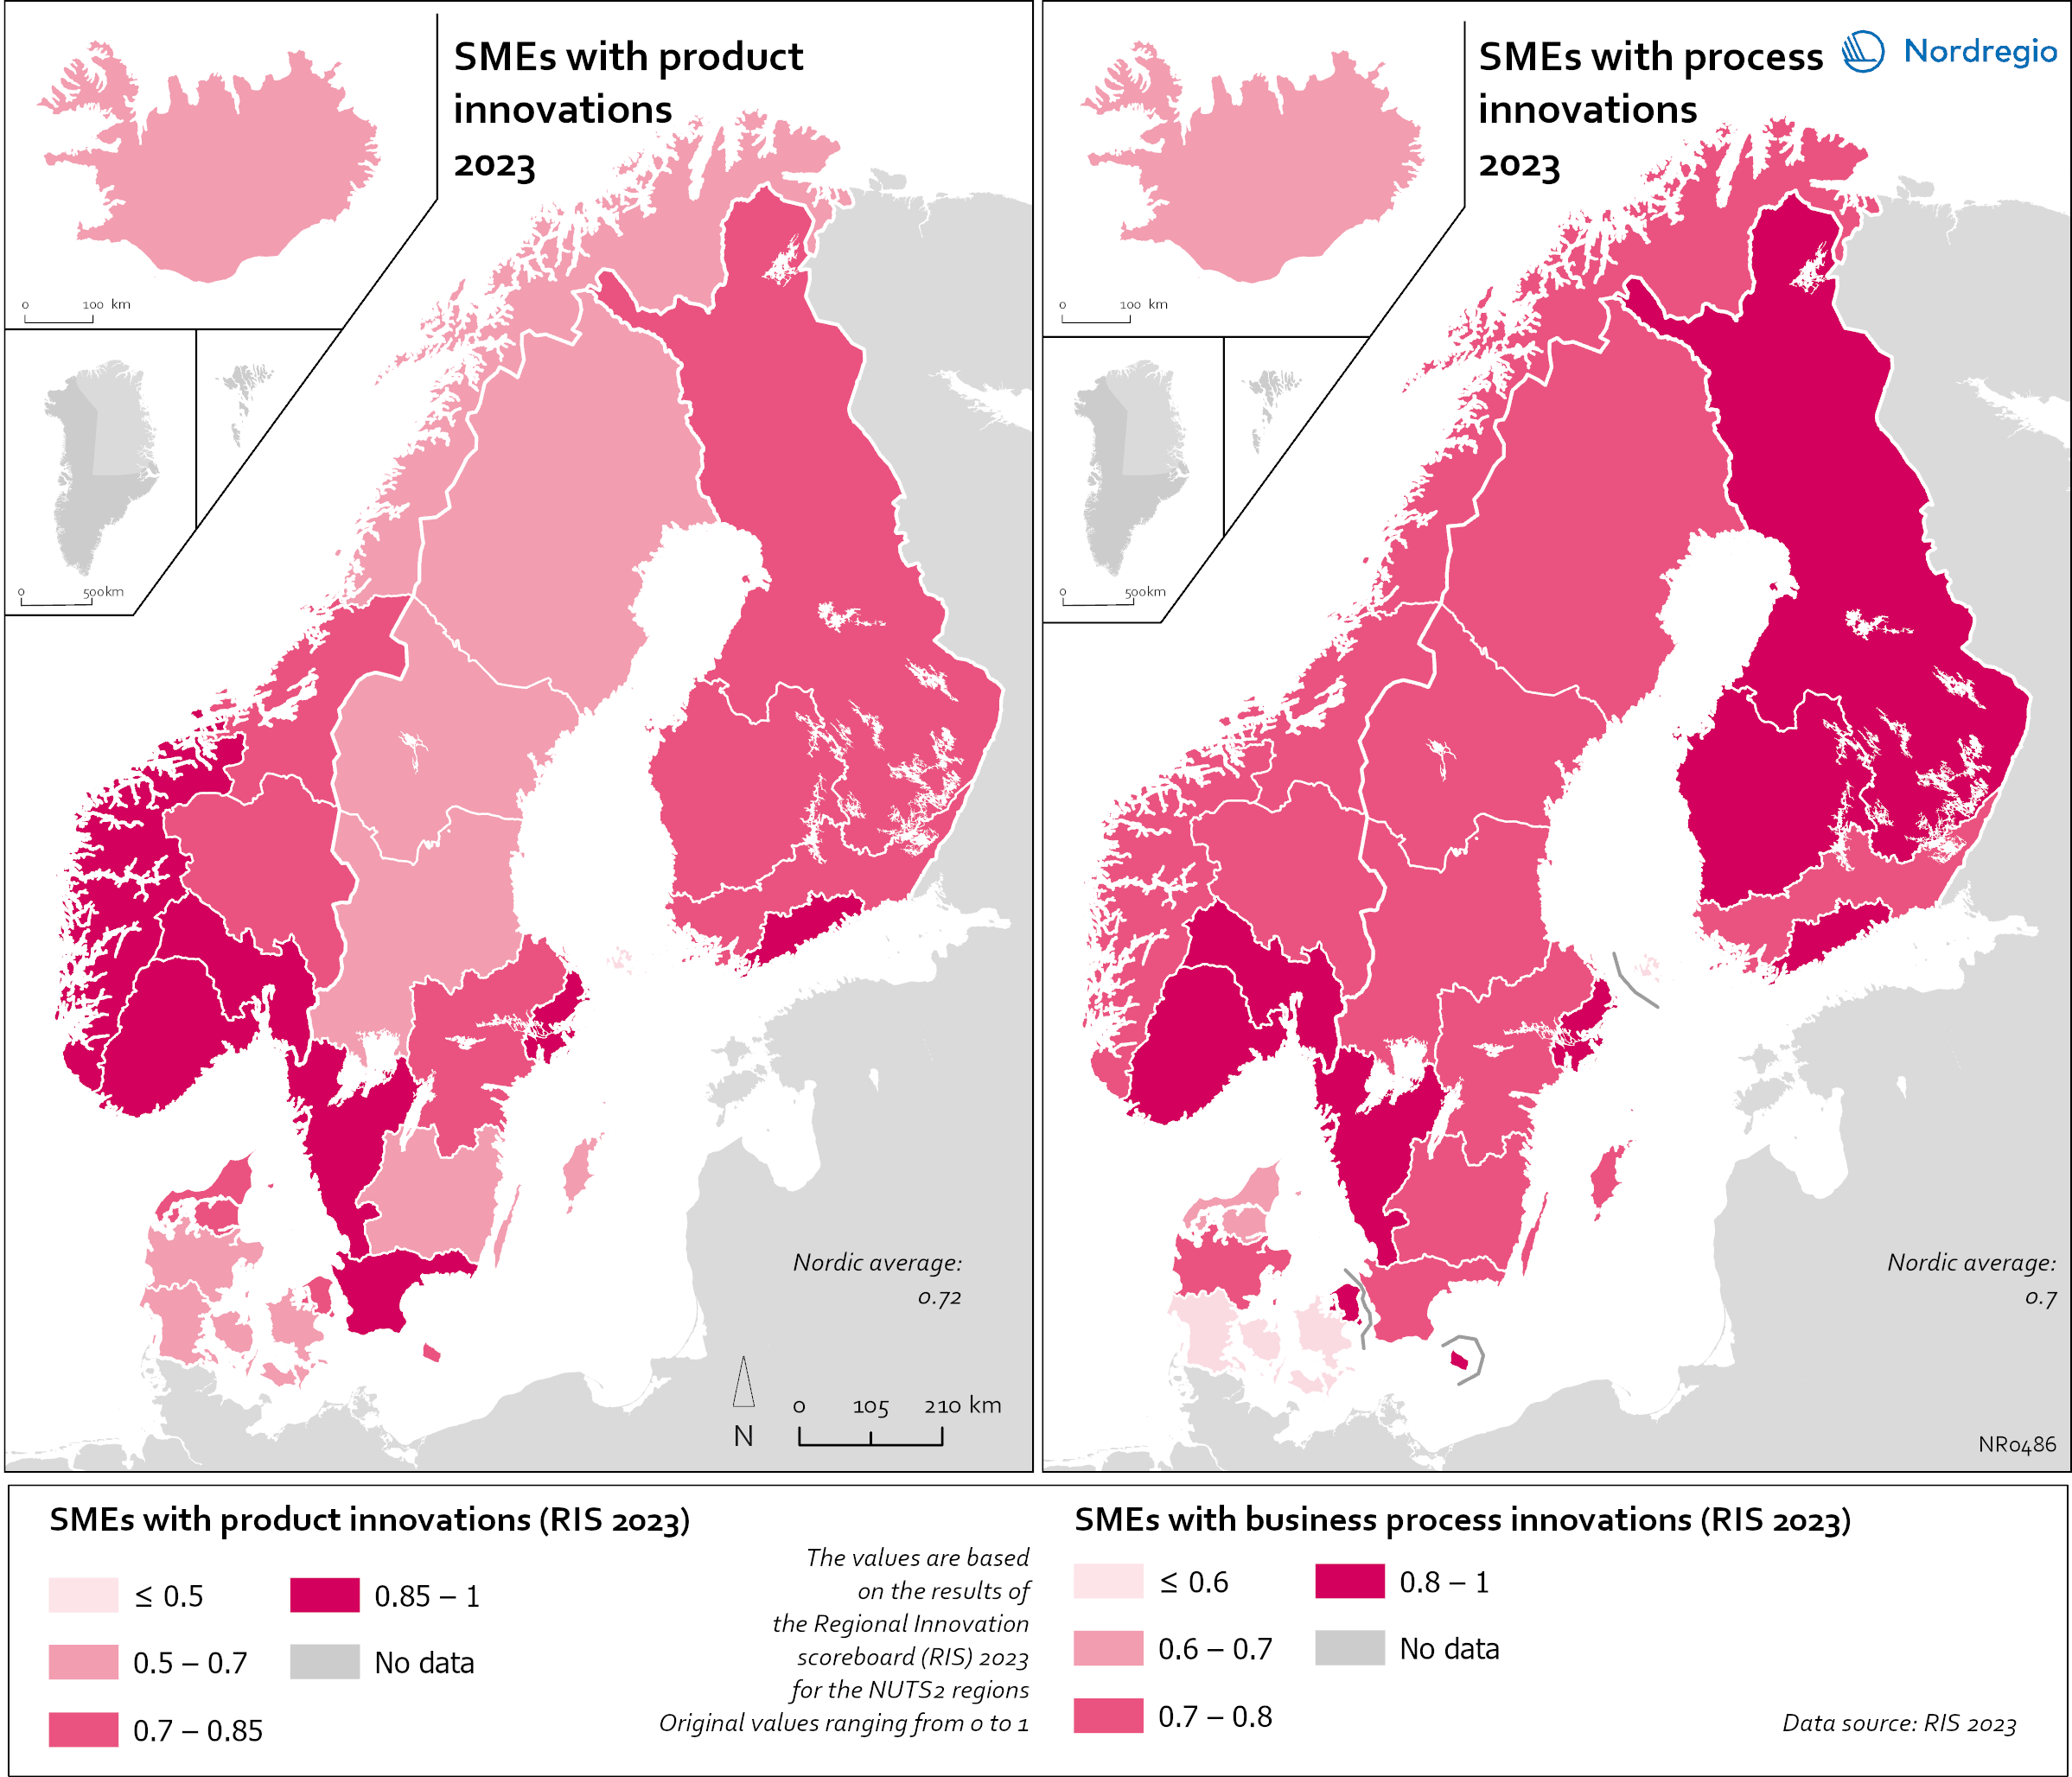
Small and Medium Sized Enterprises (SMEs) with product and business process innovation in 2023
These maps depicts Small and medium sized enterprises (SMEs) with product innovation (left map) and process innovation (right map) in 2023. The data is displayed at the NUTS2 level and the data comes from the Regional Innovation Scoreboard 2023. The left map depicts SMEs introducing product innovations as a percentage of SMEs in the Nordic regions, calculated as the share of SMEs who introduced at least one product innovation. The values for the map are normalised from 0–10. In this context, a product innovation is defined as the market introduction of a good or service that is new or significantly improved with respect to its capabilities, user-friendliness, components, or sub-systems. Rural regions tend to have lower levels of SMEs with product innovations, while urban regions have the highest levels. In 2023, Åland (0.235) had the lowest number of SMEs with product innovations in the Nordic Region, while Oslo had the highest (1.0). Etelä-Suomi and Stockholm regions were slightly behind, with 0.954 and 0.948, respectively. In Denmark, the leading regions were the Capital Region (Hovedstaden) and Northern Jutland (Nordjylland), with 0.719 and 0.715, respectively. Southern Denmark (Syddanmark) had the lowest level in Denmark, at 0.545. In Norway, the lowest value was in Northern Norway (Nord-Norge), 0.67, while in Sweden it was Middle Norrland (Mellersta Norrland), with 0.53. Taken as an average across the Nordic countries, Norway has a significantly higher number of SMEs with product innovations than the other countries. The right map shows the share of SMEs introducing at least one business-process innovation, which includes process, marketing, and organisational innovations. In general, Nordic SMEs are more likely to innovate in products rather than processes. The highest shares of process-innovating SMEs are found in most of the Finnish regions ranging from 0,79 in Länsi-Suomi to 0,91 in Etelä-Suomi, except of Åland…
 2025 April
 - Economy
- Nordic Region
- Research and innovation
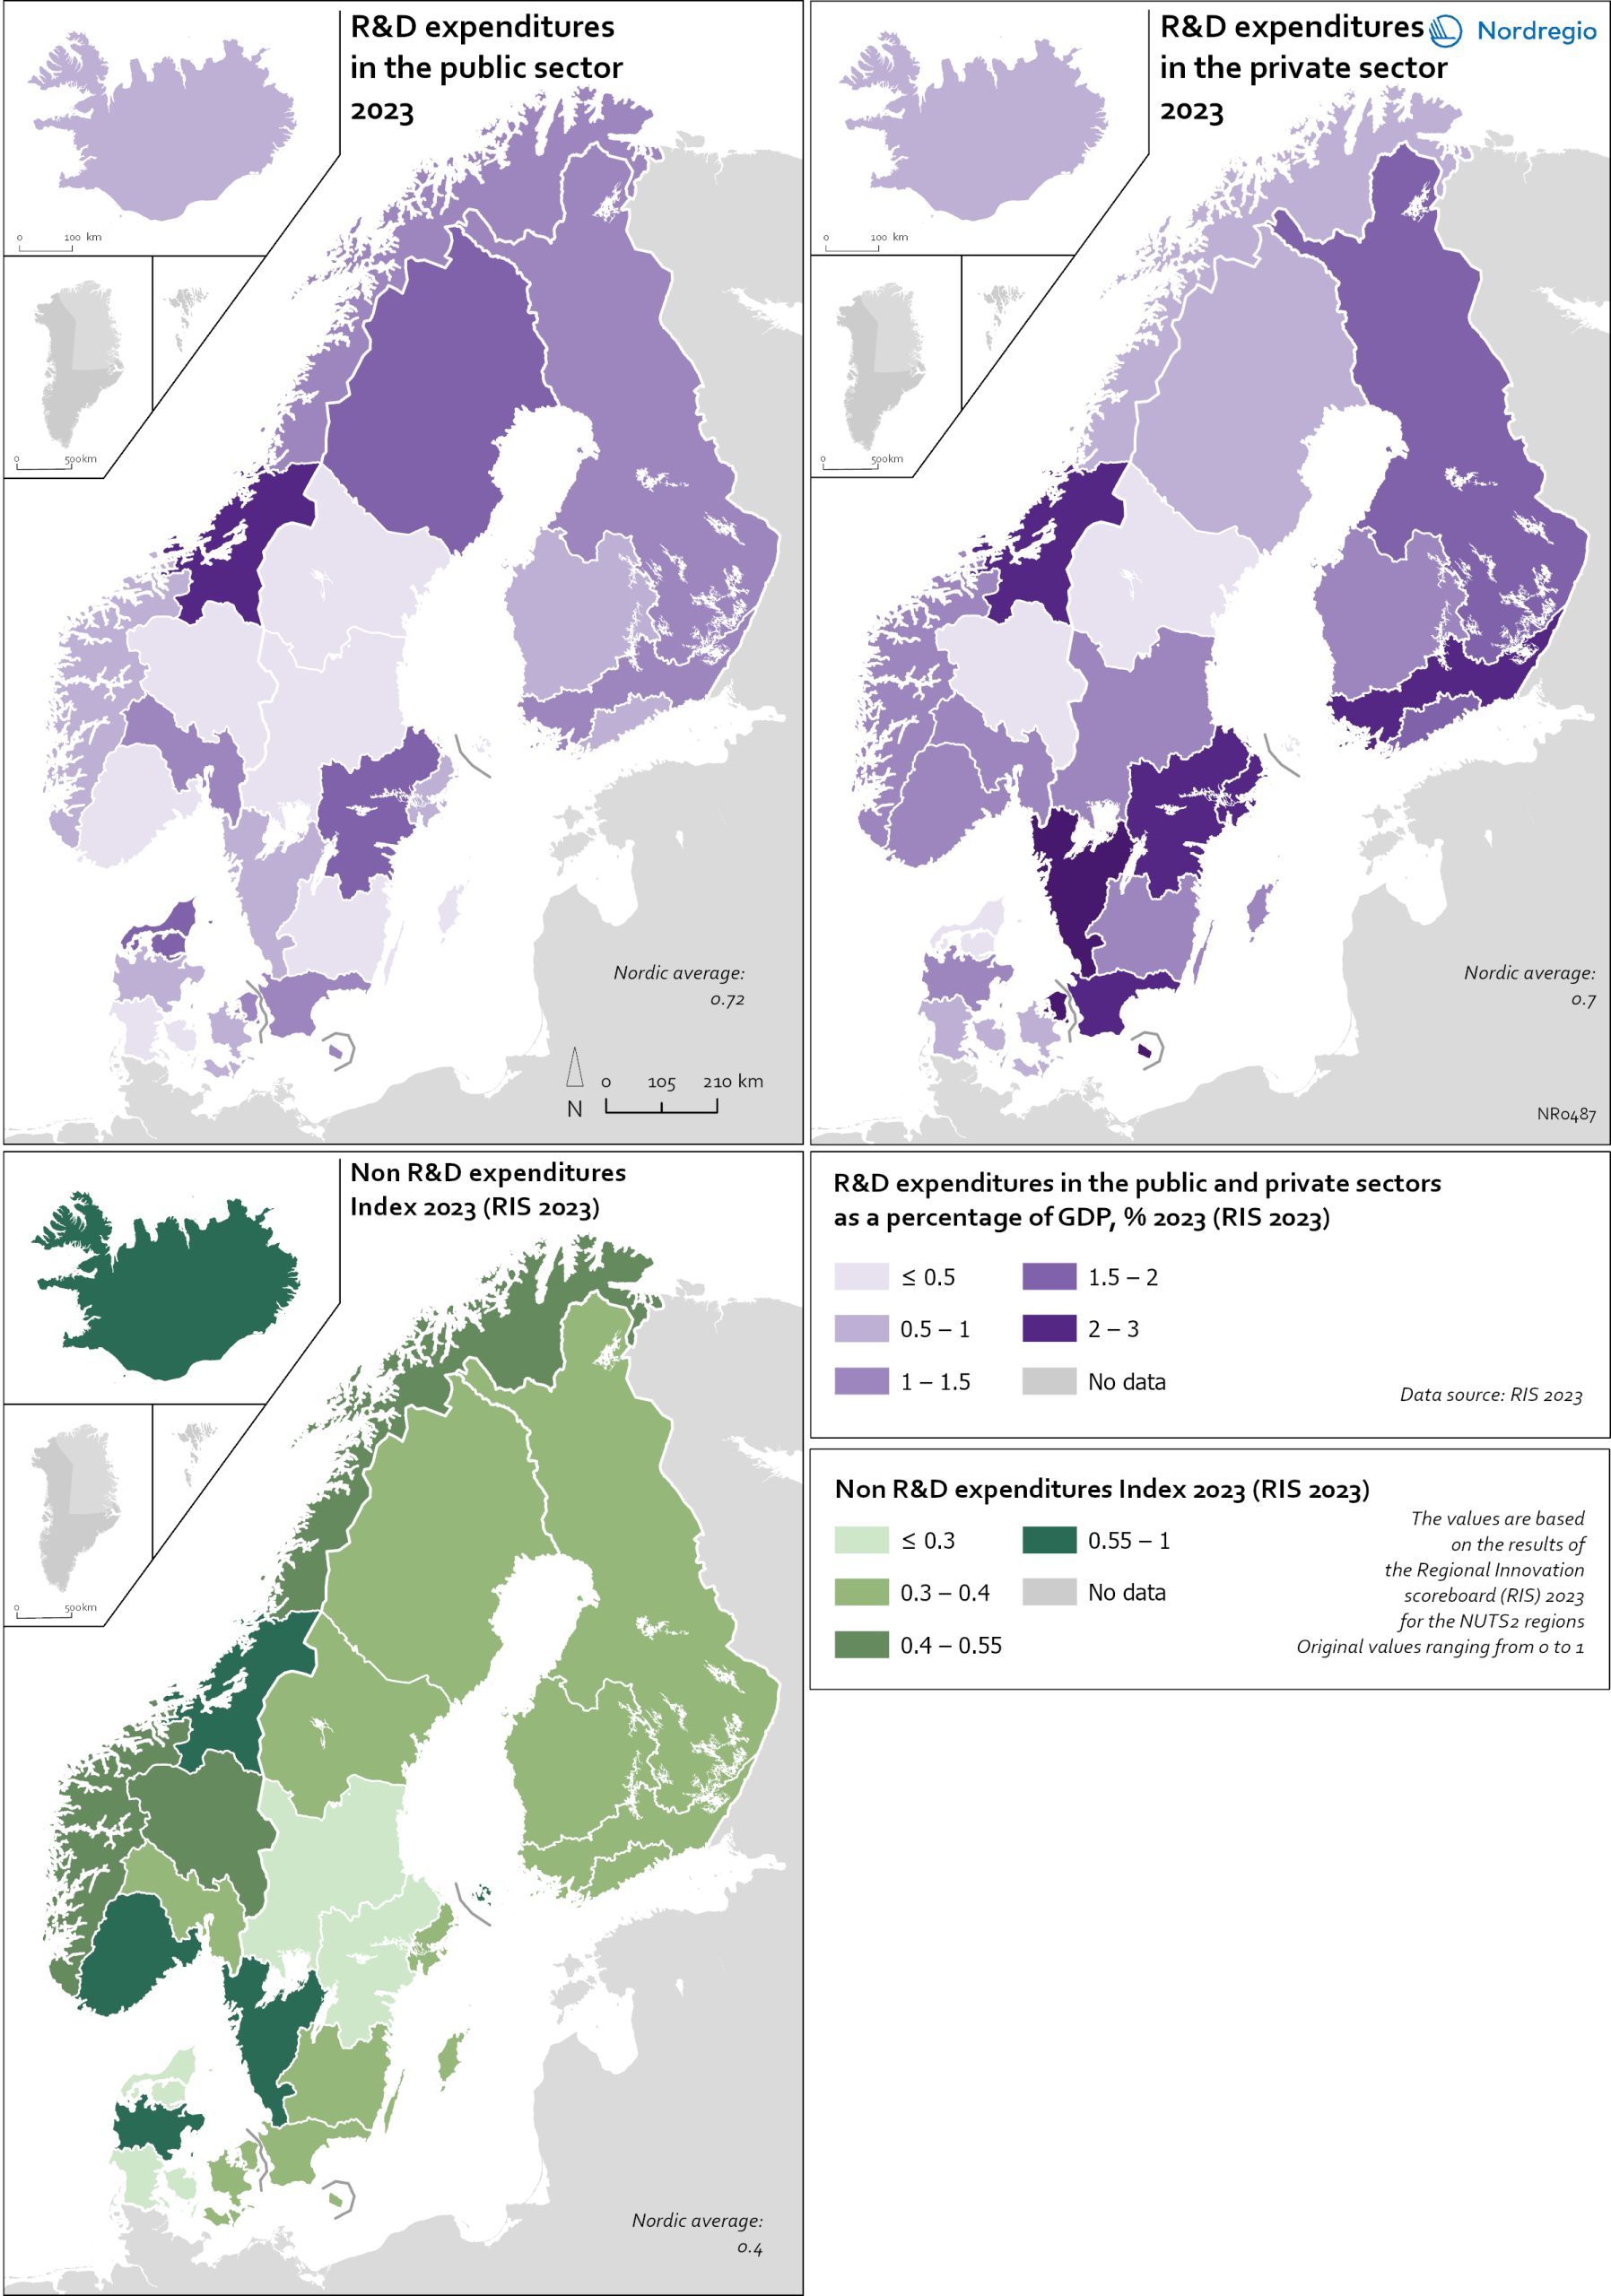
R&D and non-R&D expenditures in the public and private sector
These maps shows the expenditure on Research and Development (R&D) in the public and business sectors as a percentage of regional GDP, along with non-R&D innovation expenditure in Small and Medium Enterprises (SMEs) as a percentage of turnover. Together, these metrics offer a comprehensive understanding of the innovation landscape and provide insights into governments’ and higher education institutions’ commitment to foundational research, as well as the competitiveness and dynamism of the business environment and SMEs’ innovation capacity. By considering investment in both R&D and non-R&D activities, these indicators illustrate a broad spectrum of innovation drivers, from basic research to market-driven initiatives, and underscore the diverse pathways through which innovation fosters economic growth and social progress First, the top left map showcases R&D expenditure in the public sector as a percentage of GDP in the Nordic countries in 2023. In that year, the European level of R&D expenditure in the public sector, as a percentage of GDP, was 0.78%. By comparison, the Nordic average was 0.9%. While the more urban regions, in general, lead the Nordic regions, this is not always the case, as shown by the variation between the frontrunners. The leading region is Trøndelag (including Norway’s third-largest city, Trondheim), with 2.30% of regional GDP. It is in third place in the EU as a whole. The next regions are Övre Norrland with 1.77%, Northern Jutland with 1.54%, Östra Mellansverige with 1.52%, and Hovedstaden with 1.49%. A common feature of most of the top-ranking regions is that they host universities and other higher education institutions known for innovation practices. Most Nordic regions have not seen significant increases or decreases in public R&D spending between 2016 and 2023. The top right map focuses on the private sector’s investment in research and development activities and depicts R&D expenditure in the business sector…
- 2025 April
- Economy
- Nordic Region
- Research and innovation
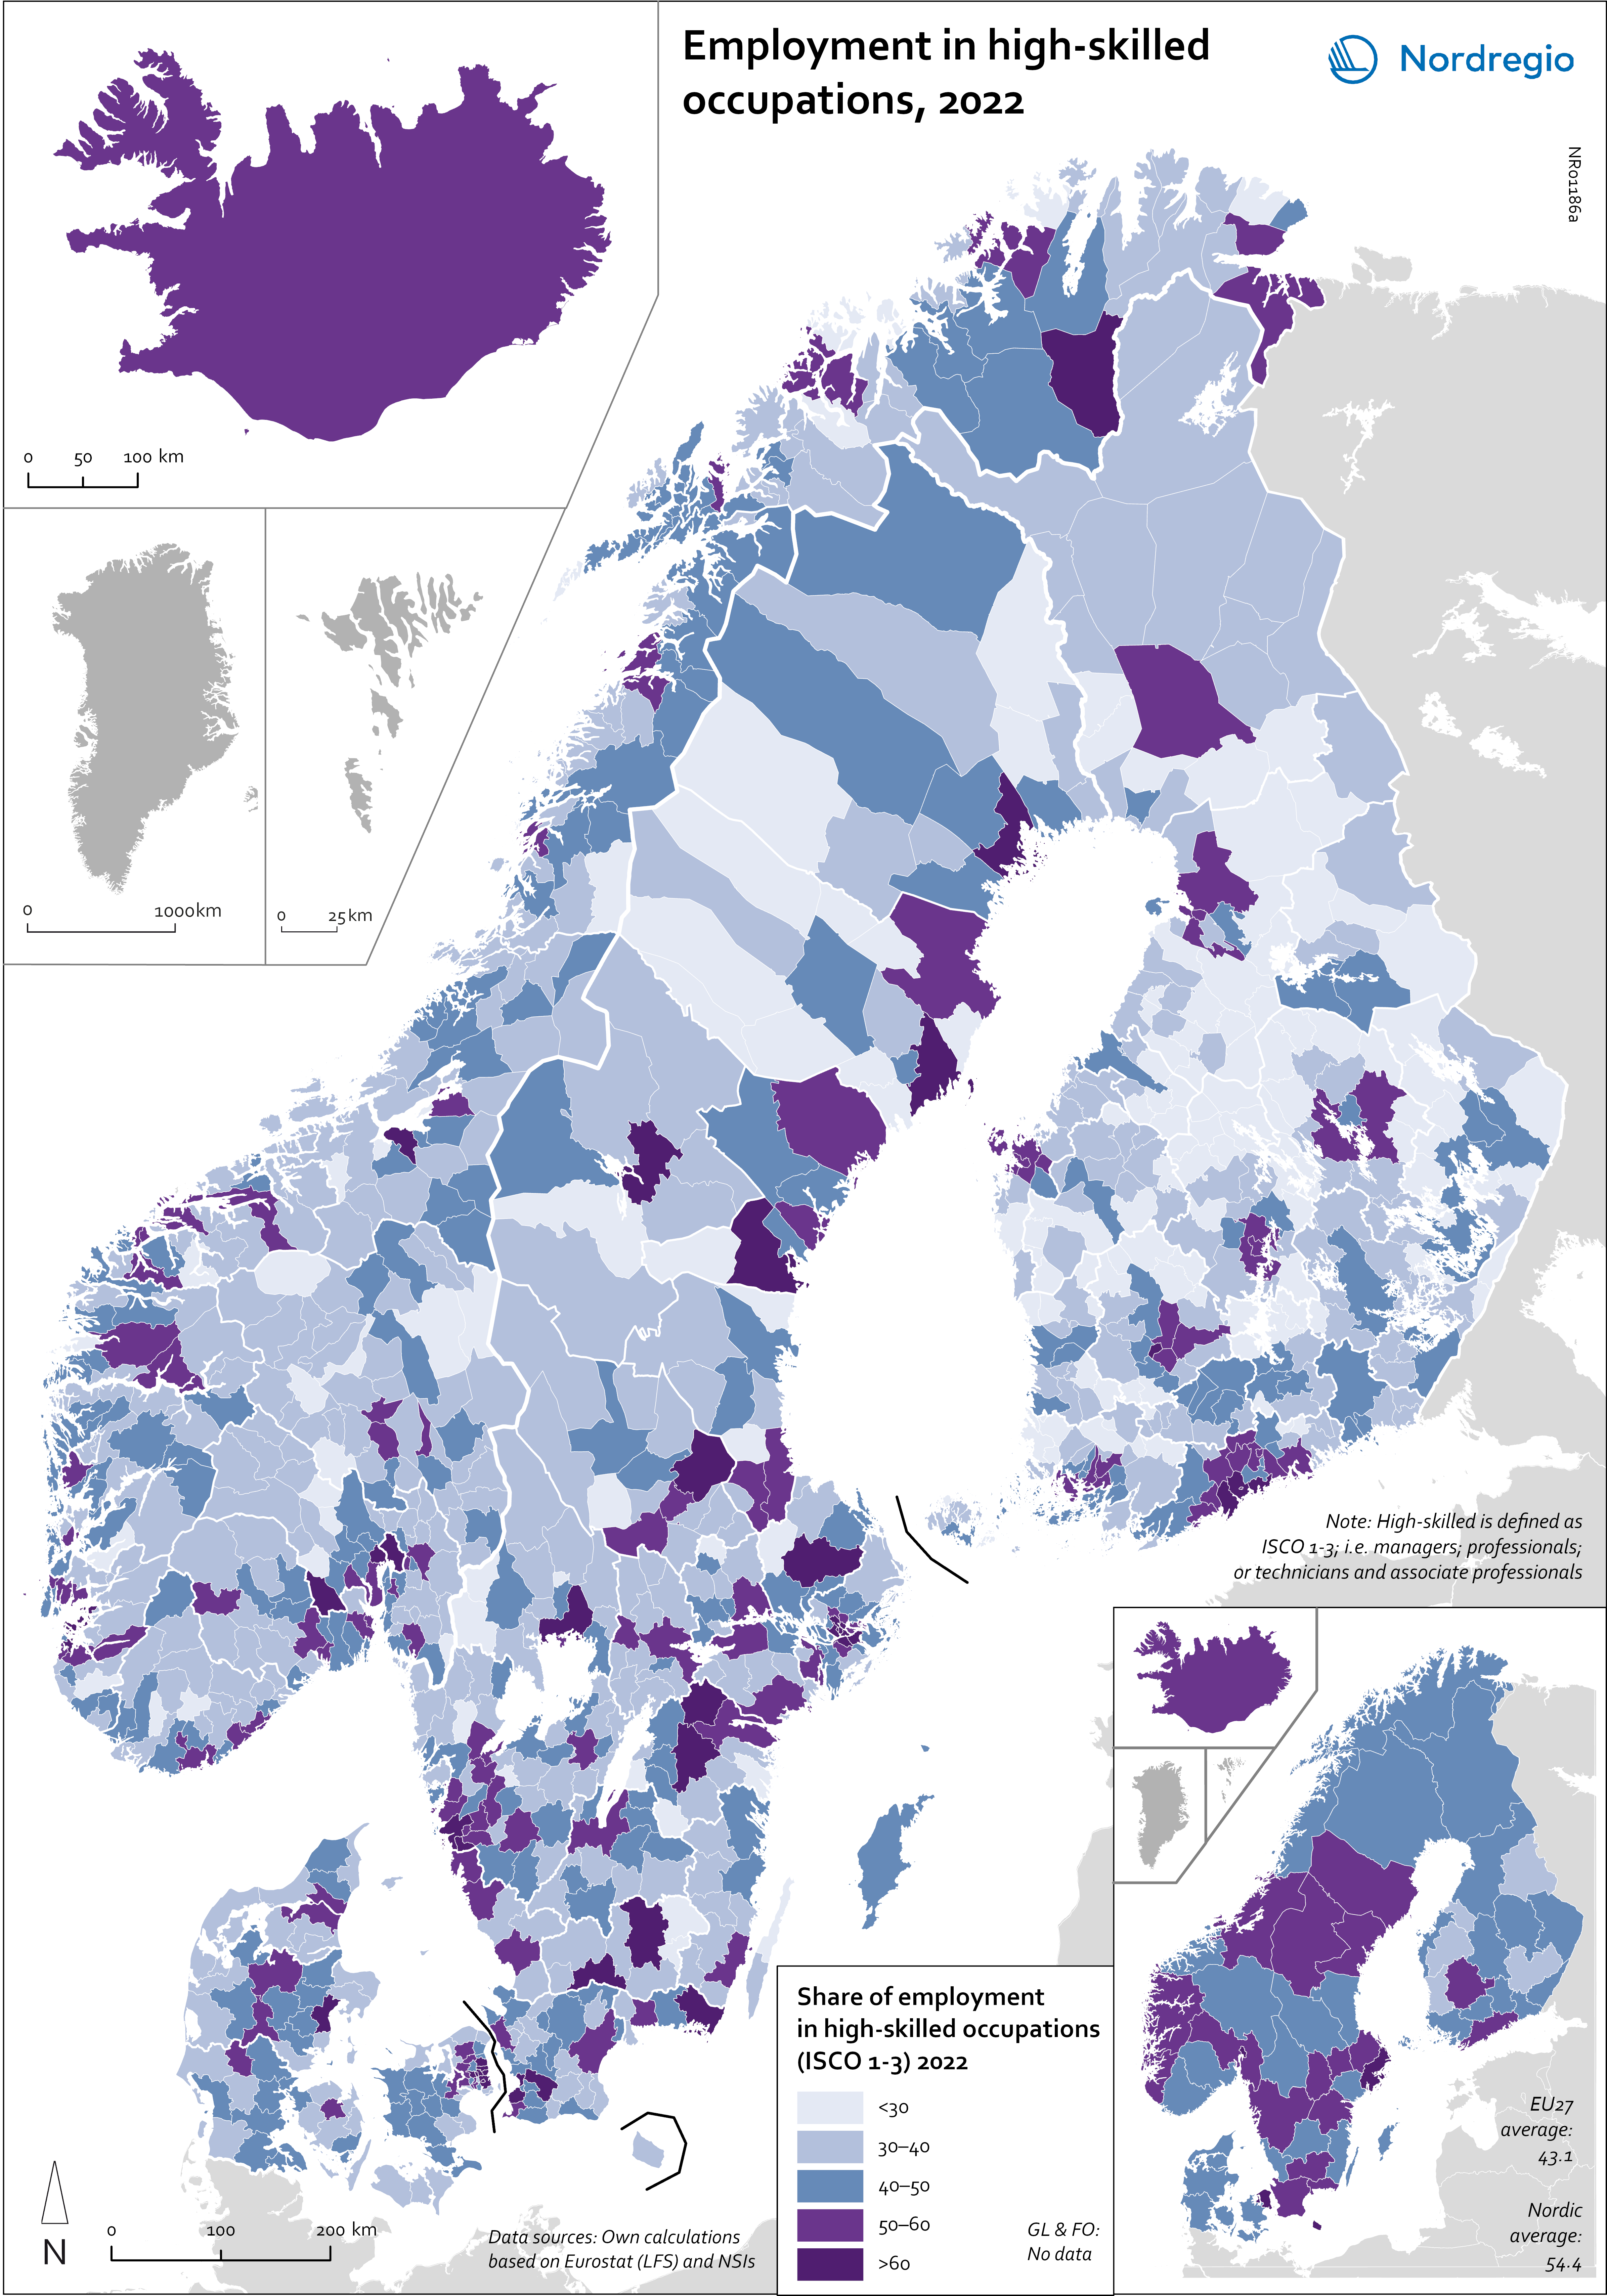
Employment in high-skilled occupations 2022
This map displays the share of high-skilled workers as a share of the total number of workers in Nordic municipalities (big map) and regions (small map). “High-skilled workers” is here defined as group 1-3 (Managers, Professionals and Techinicians/associated professionals) of the International Standard Classification of Occupations (ISCO). For Iceland national data is used. The EU average of high-skilled workers is 43%, and the Nordic countries are at the top of the rankings – 49.5% in Finland, 51.1% in Denmark, 54.2% in Norway, 54.5% in Iceland and 58.9% in Sweden. On a regional level, the highest share is in the capitals and bigger cities, such as Stockholm (72%), Oslo (71%), Hovedstaden (Copenhagen) (60%), Uppsala (60%) and Uusima (Helsinki) (59%). The lowest shares are in the Finnish regions of EteläPohjanmaa, Keski-Pohjanmaa, Satakunta and Etelä-Savo (less than 40%). However, this does not necessarily mean that employers will have a greater chance of successfully recruiting high-skilled workers in the future, partly because those in this group already have jobs and partly due to generally lower investments in education.
- 2025 April
- Labour force
- Nordic Region
- Research and innovation
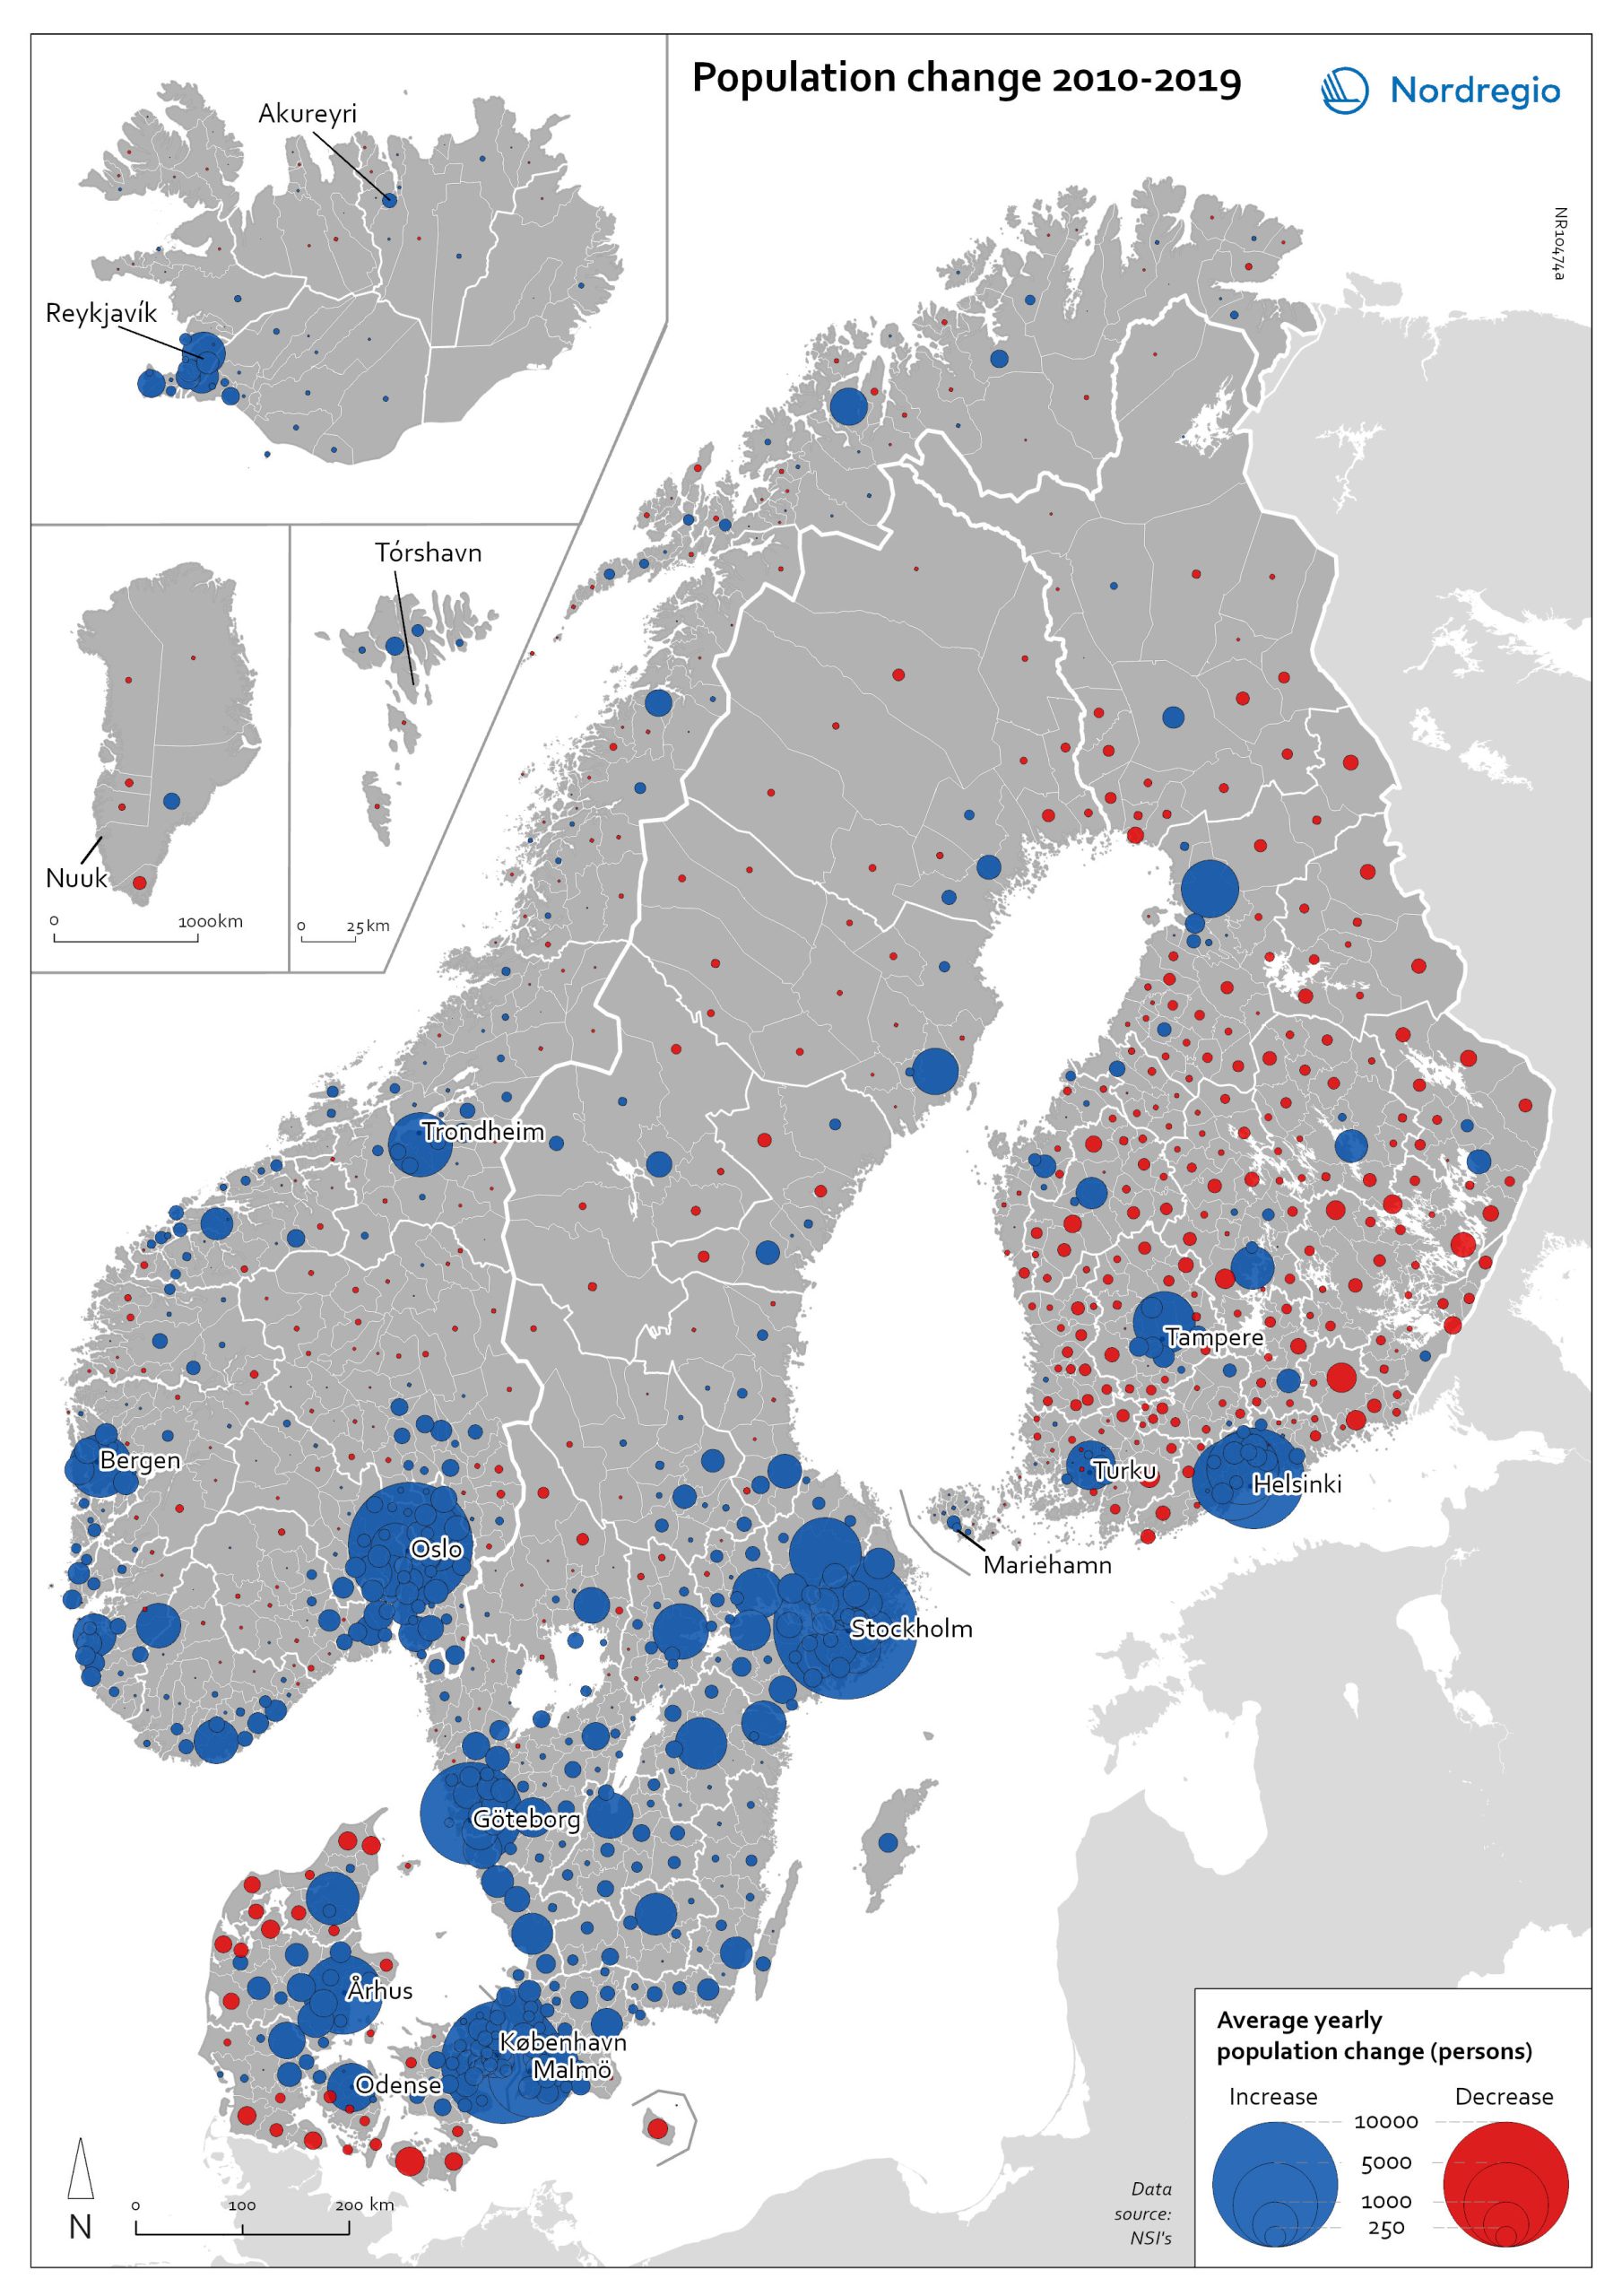
Population change 2010-2019
The map shows the type (positive or negative) and size of population change from 2010 to 2019 in all nordic municipalities. In Finland, Denmark, and Greenland there is a clear pattern of population growth in and around the larger cities and population decline in rural areas. Geographical and administrative differences mean that a much larger number of rural municipalities in Finland are dealing with population decline. Sweden experienced substantial population growth between 2010 and 2019, primarily due to high levels of international immigration. As a result, many rural areas also experienced population growth, particularly in the south of Sweden. However, in the more sparsely populated municipalities in the north of Sweden, the pattern is somewhat similar to that observed in Denmark and Finland, albeit with population decline in lower absolute numbers. Both Iceland and the Faroe Islands experienced substantial growth of their tourism industries within the period. This enabled some rural areas to maintain or even grow their populations. Norway exhibits more balanced population development in general, with a mix of population growth and decline in rural areas throughout the country.
- 2022 May
- Demography
- Migration
- Nordic Region
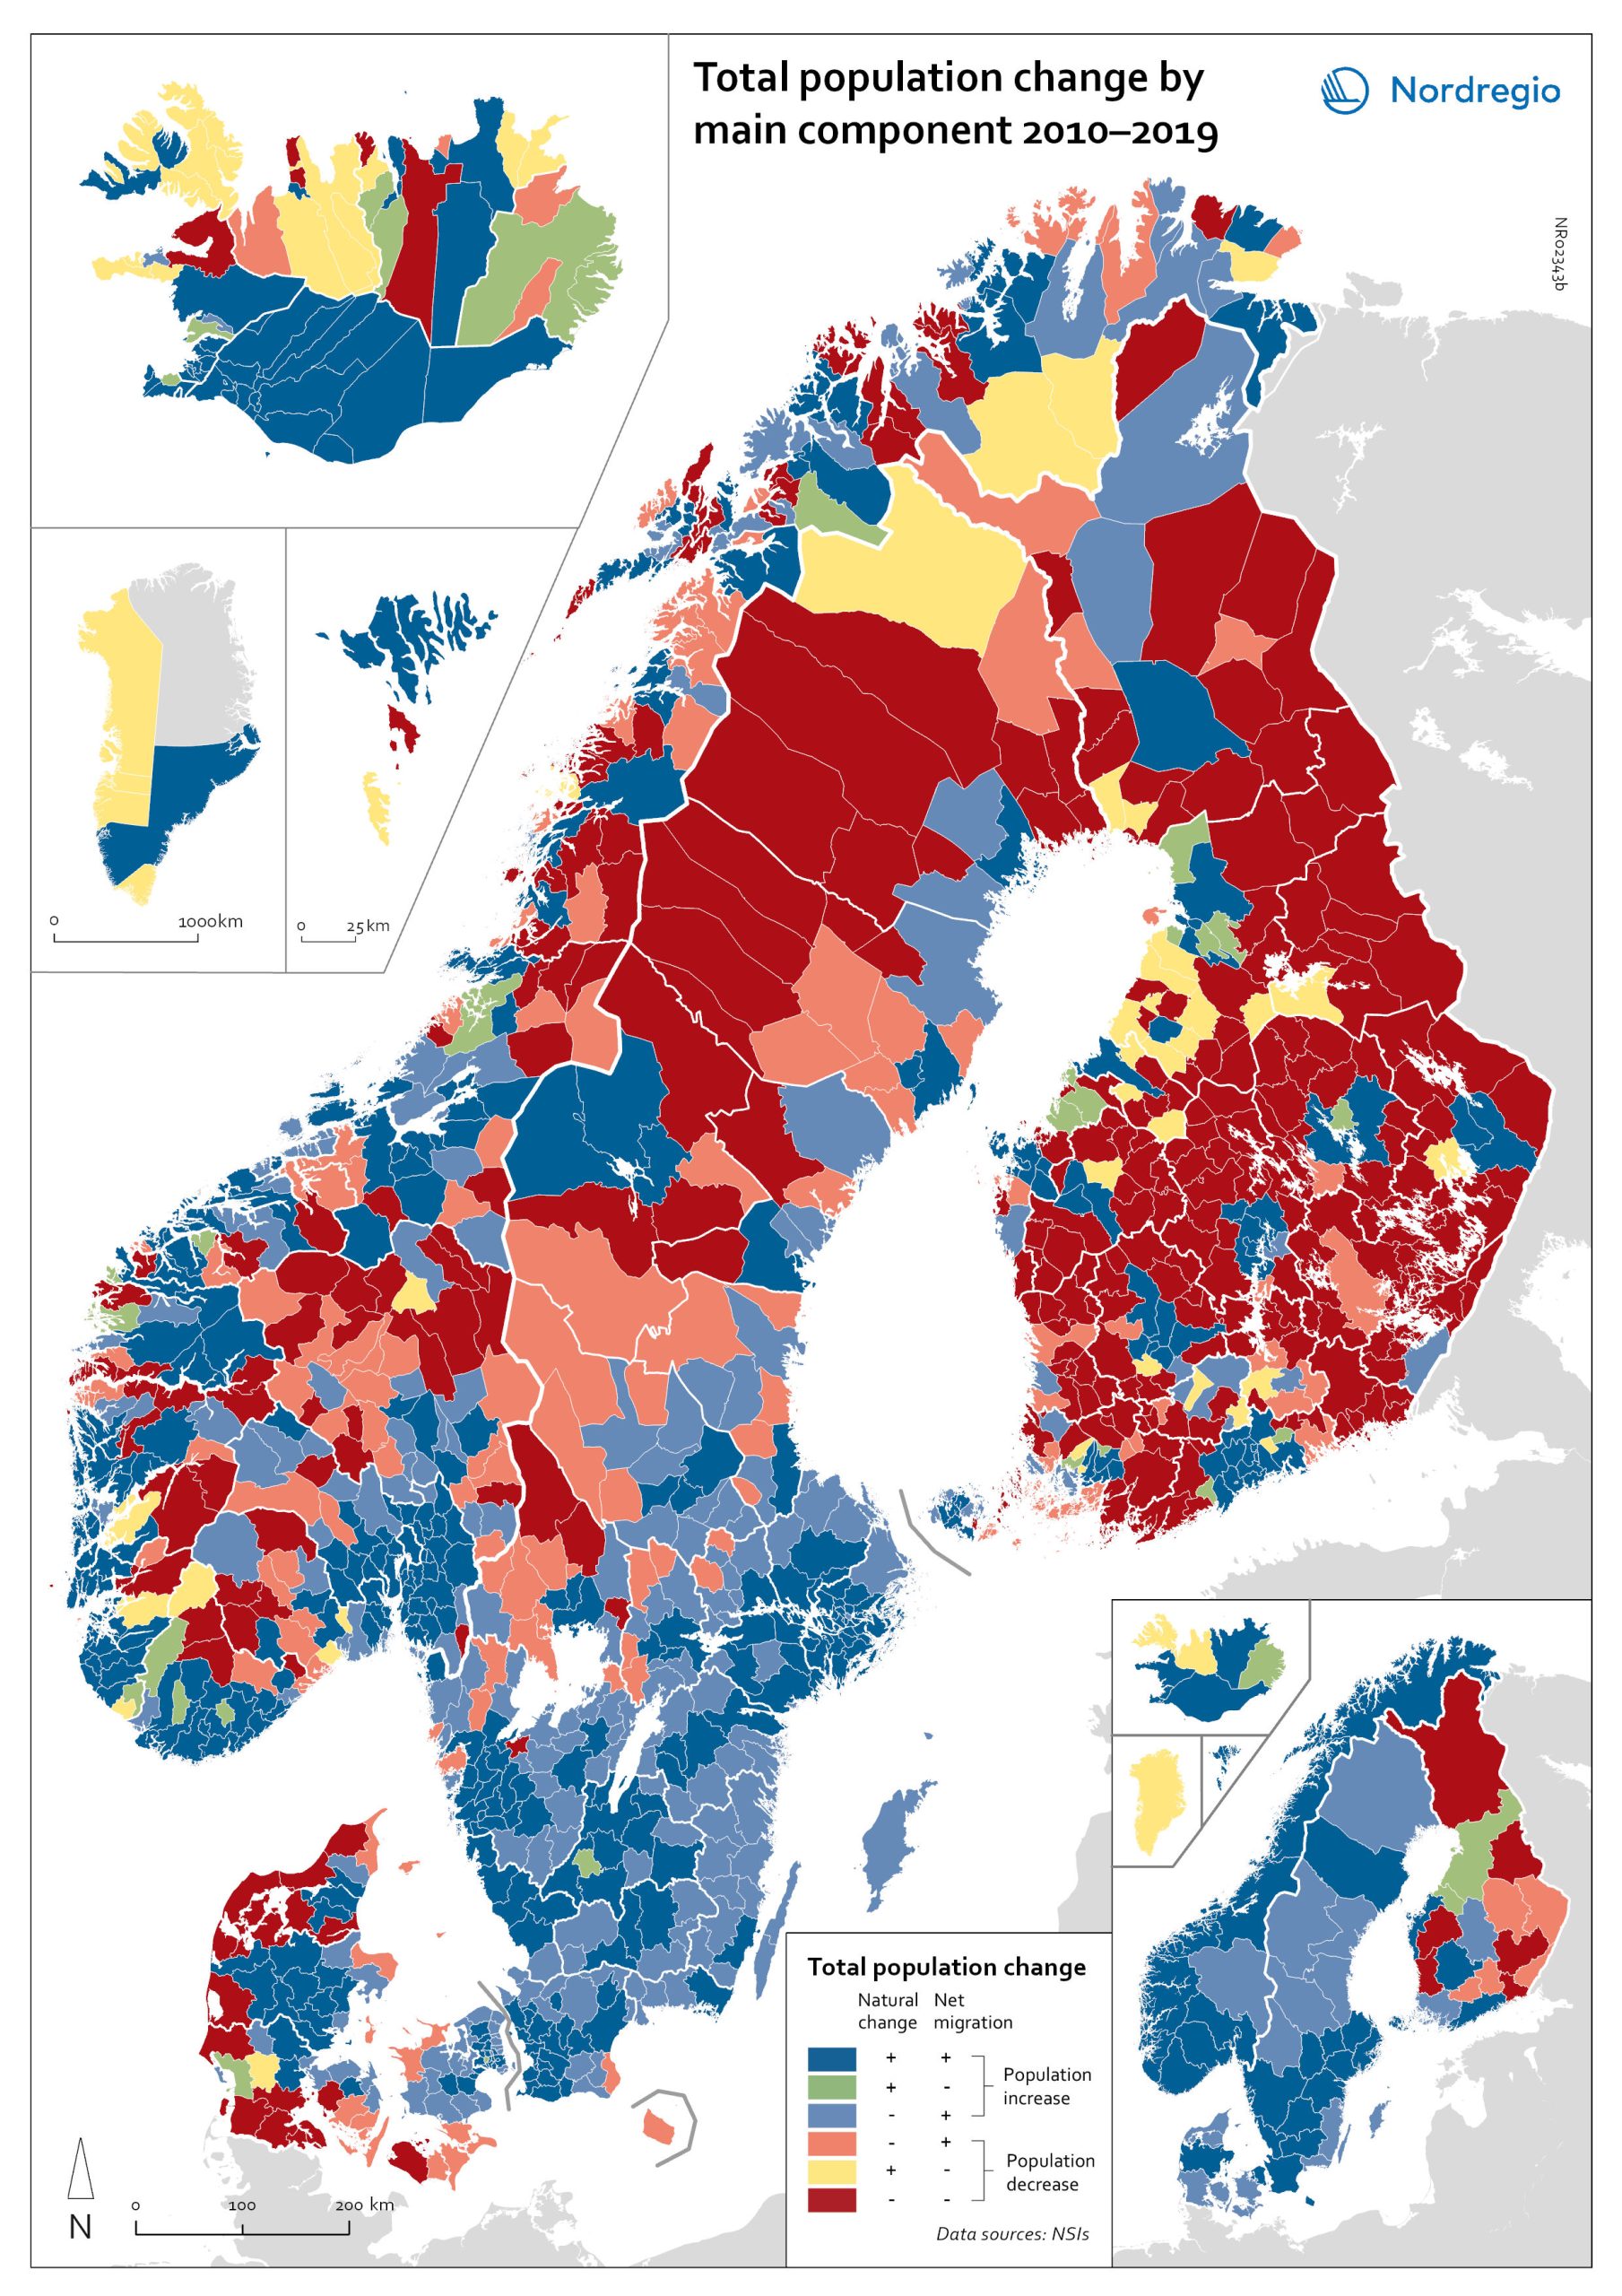
Population change by component 2010-2019
The map shows the population change by component 2010-2019. The map is related to the same map showing regional and municipal patterns in population change by component in 2020. Regions are divided into six classes of population change. Those in shades of blue or green are where the population has increased, and those in shades of red or yellow are where the population has declined. At the regional level (see small inset map), all in Denmark, all in the Faroes, most in southern Norway, southern Sweden, all but one in Iceland, all of Greenland, and a few around the capital in Helsinki had population increases in 2010-2019. Most regions in the north of Norway, Sweden, and Finland had population declines in 2010-2019. Many other regions in southern and eastern Finland also had population declines in 2010-2019, mainly because the country had more deaths than births, a trend that pre-dated the pandemic. In 2020, there were many more regions in red where populations were declining due to both natural decrease and net out-migration. At the municipal level, a more varied pattern emerges, with municipalities having quite different trends than the regions of which they form part. Many regions in western Denmark are declining because of negative natural change and outmigration. Many smaller municipalities in Norway and Sweden saw population decline from both negative natural increase and out-migration despite their regions increasing their populations. Many smaller municipalities in Finland outside the three big cities of Helsinki, Turku, and Tampere also saw population decline from both components. A similar pattern took place at the municipal level in 2020 of there being many more regions in red than in the previous decade.
- 2022 March
- Demography
- Migration
- Nordic Region
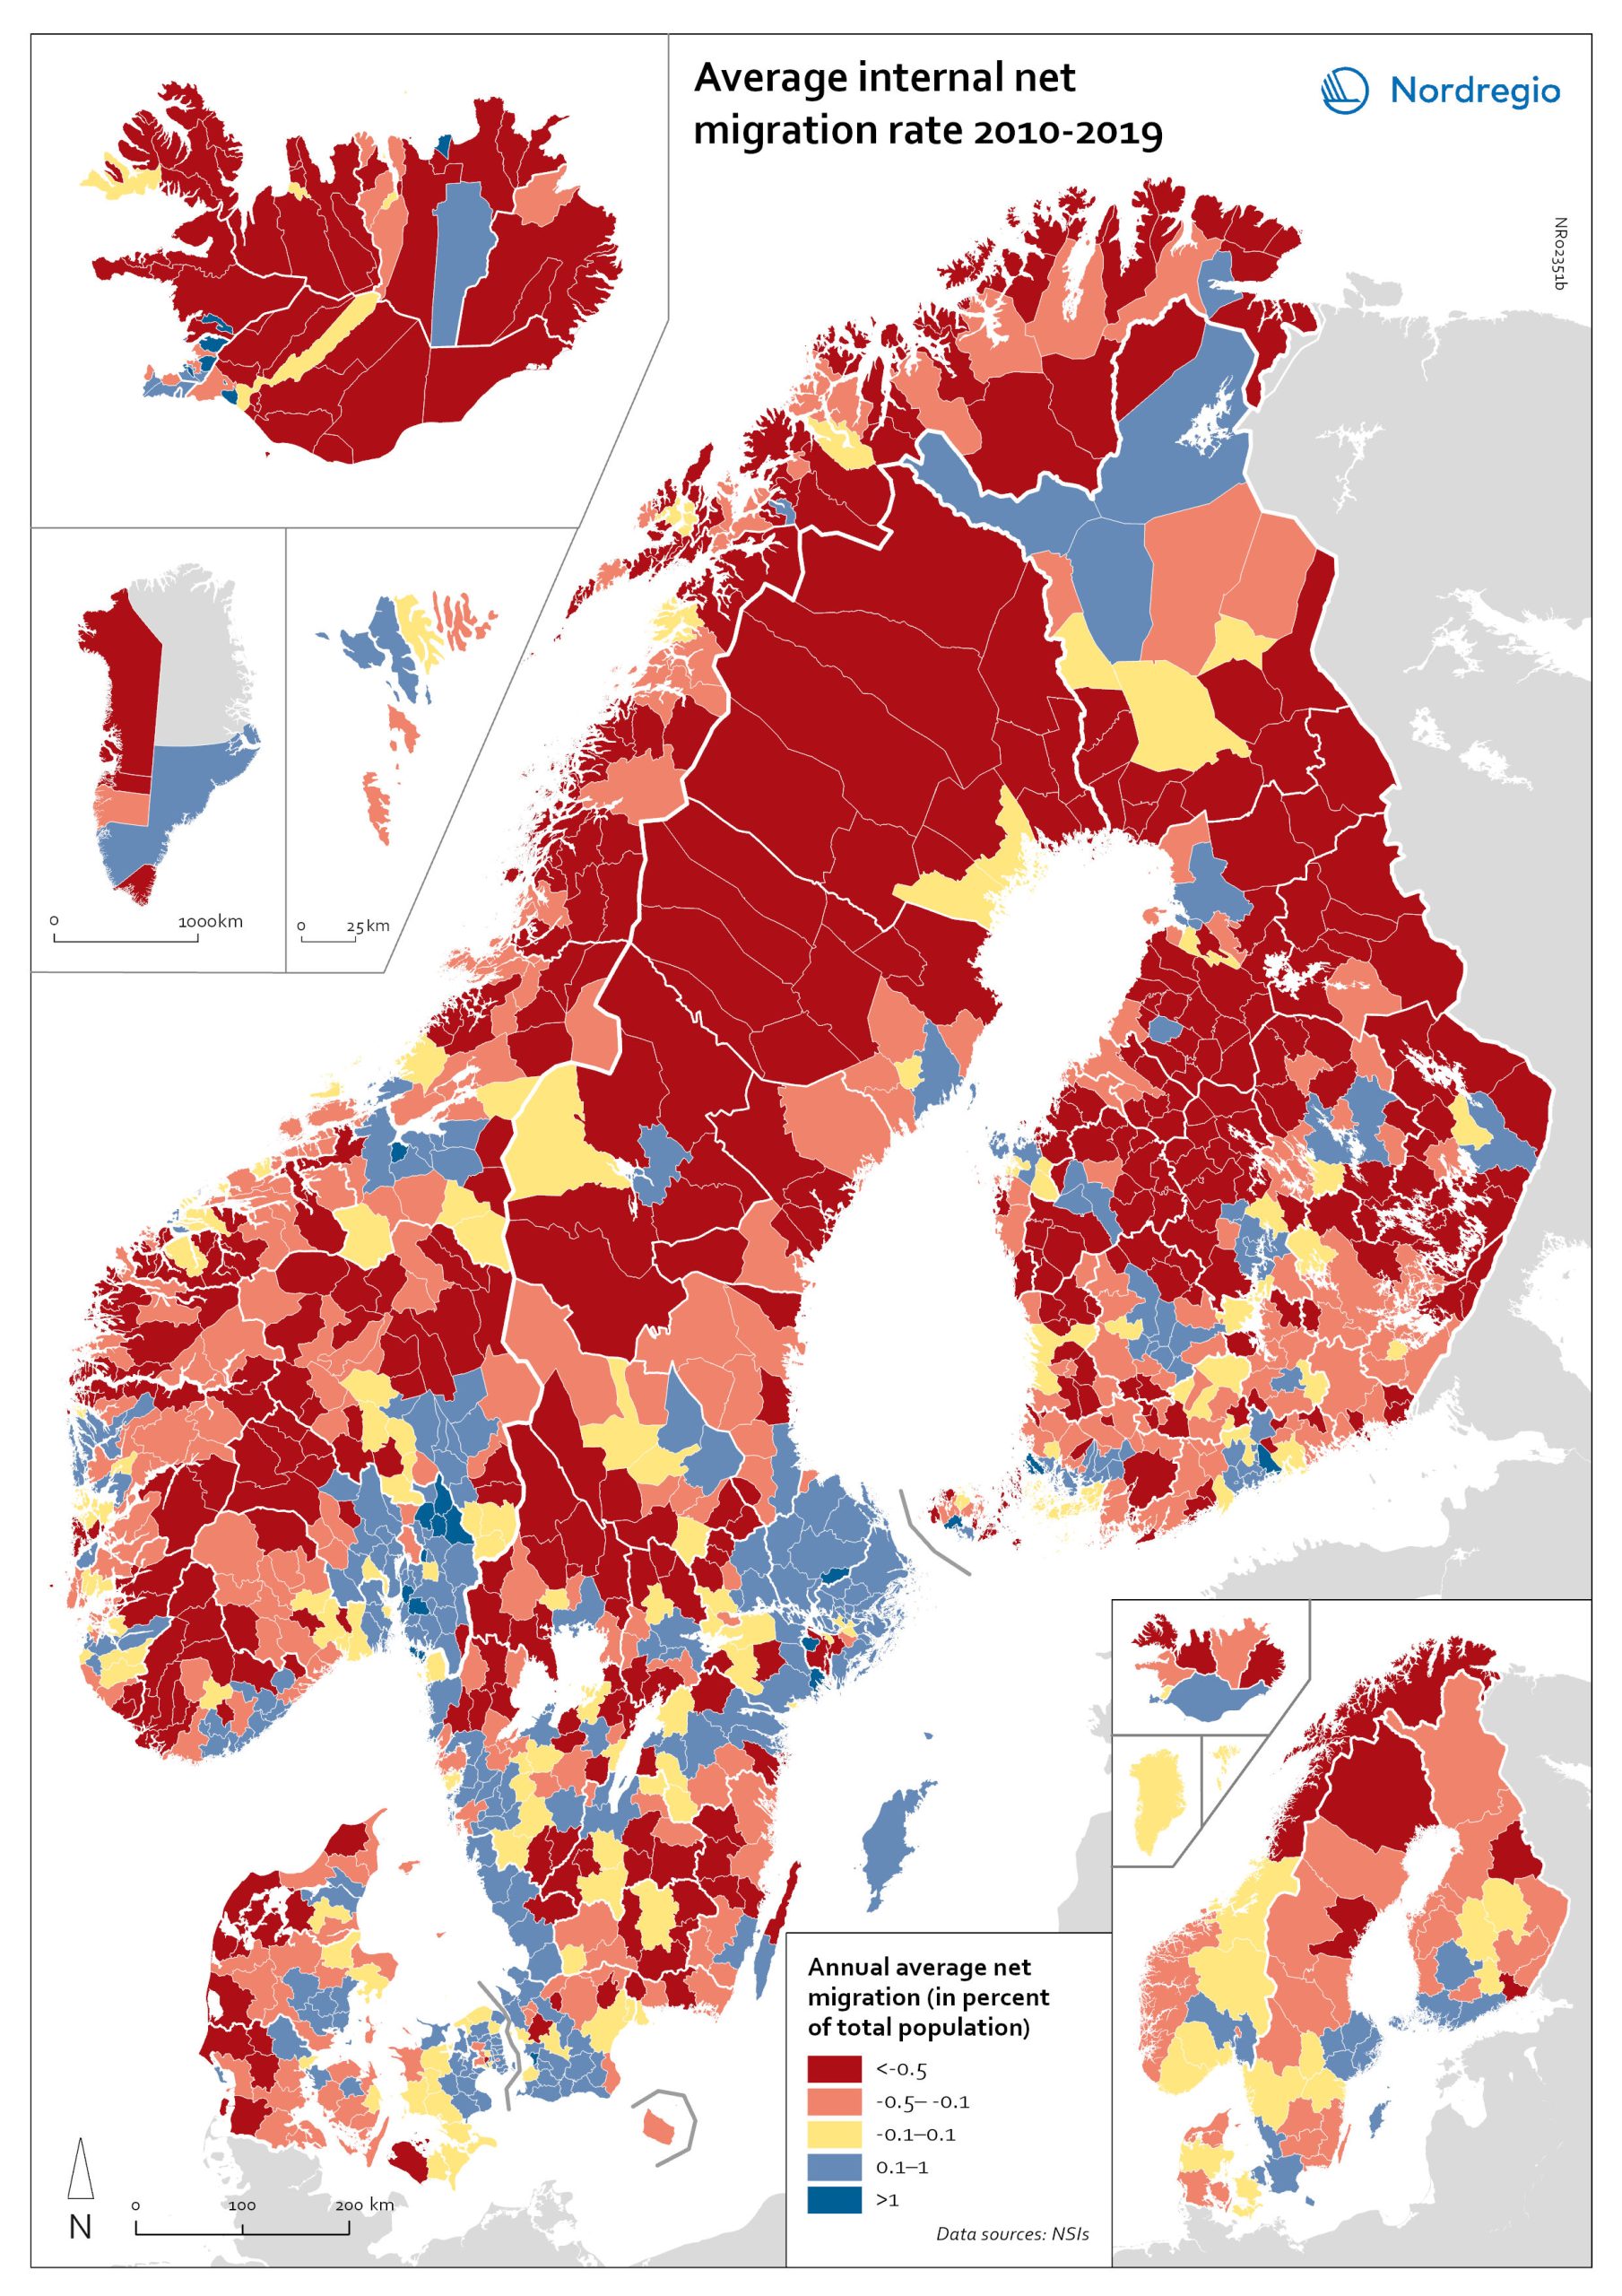
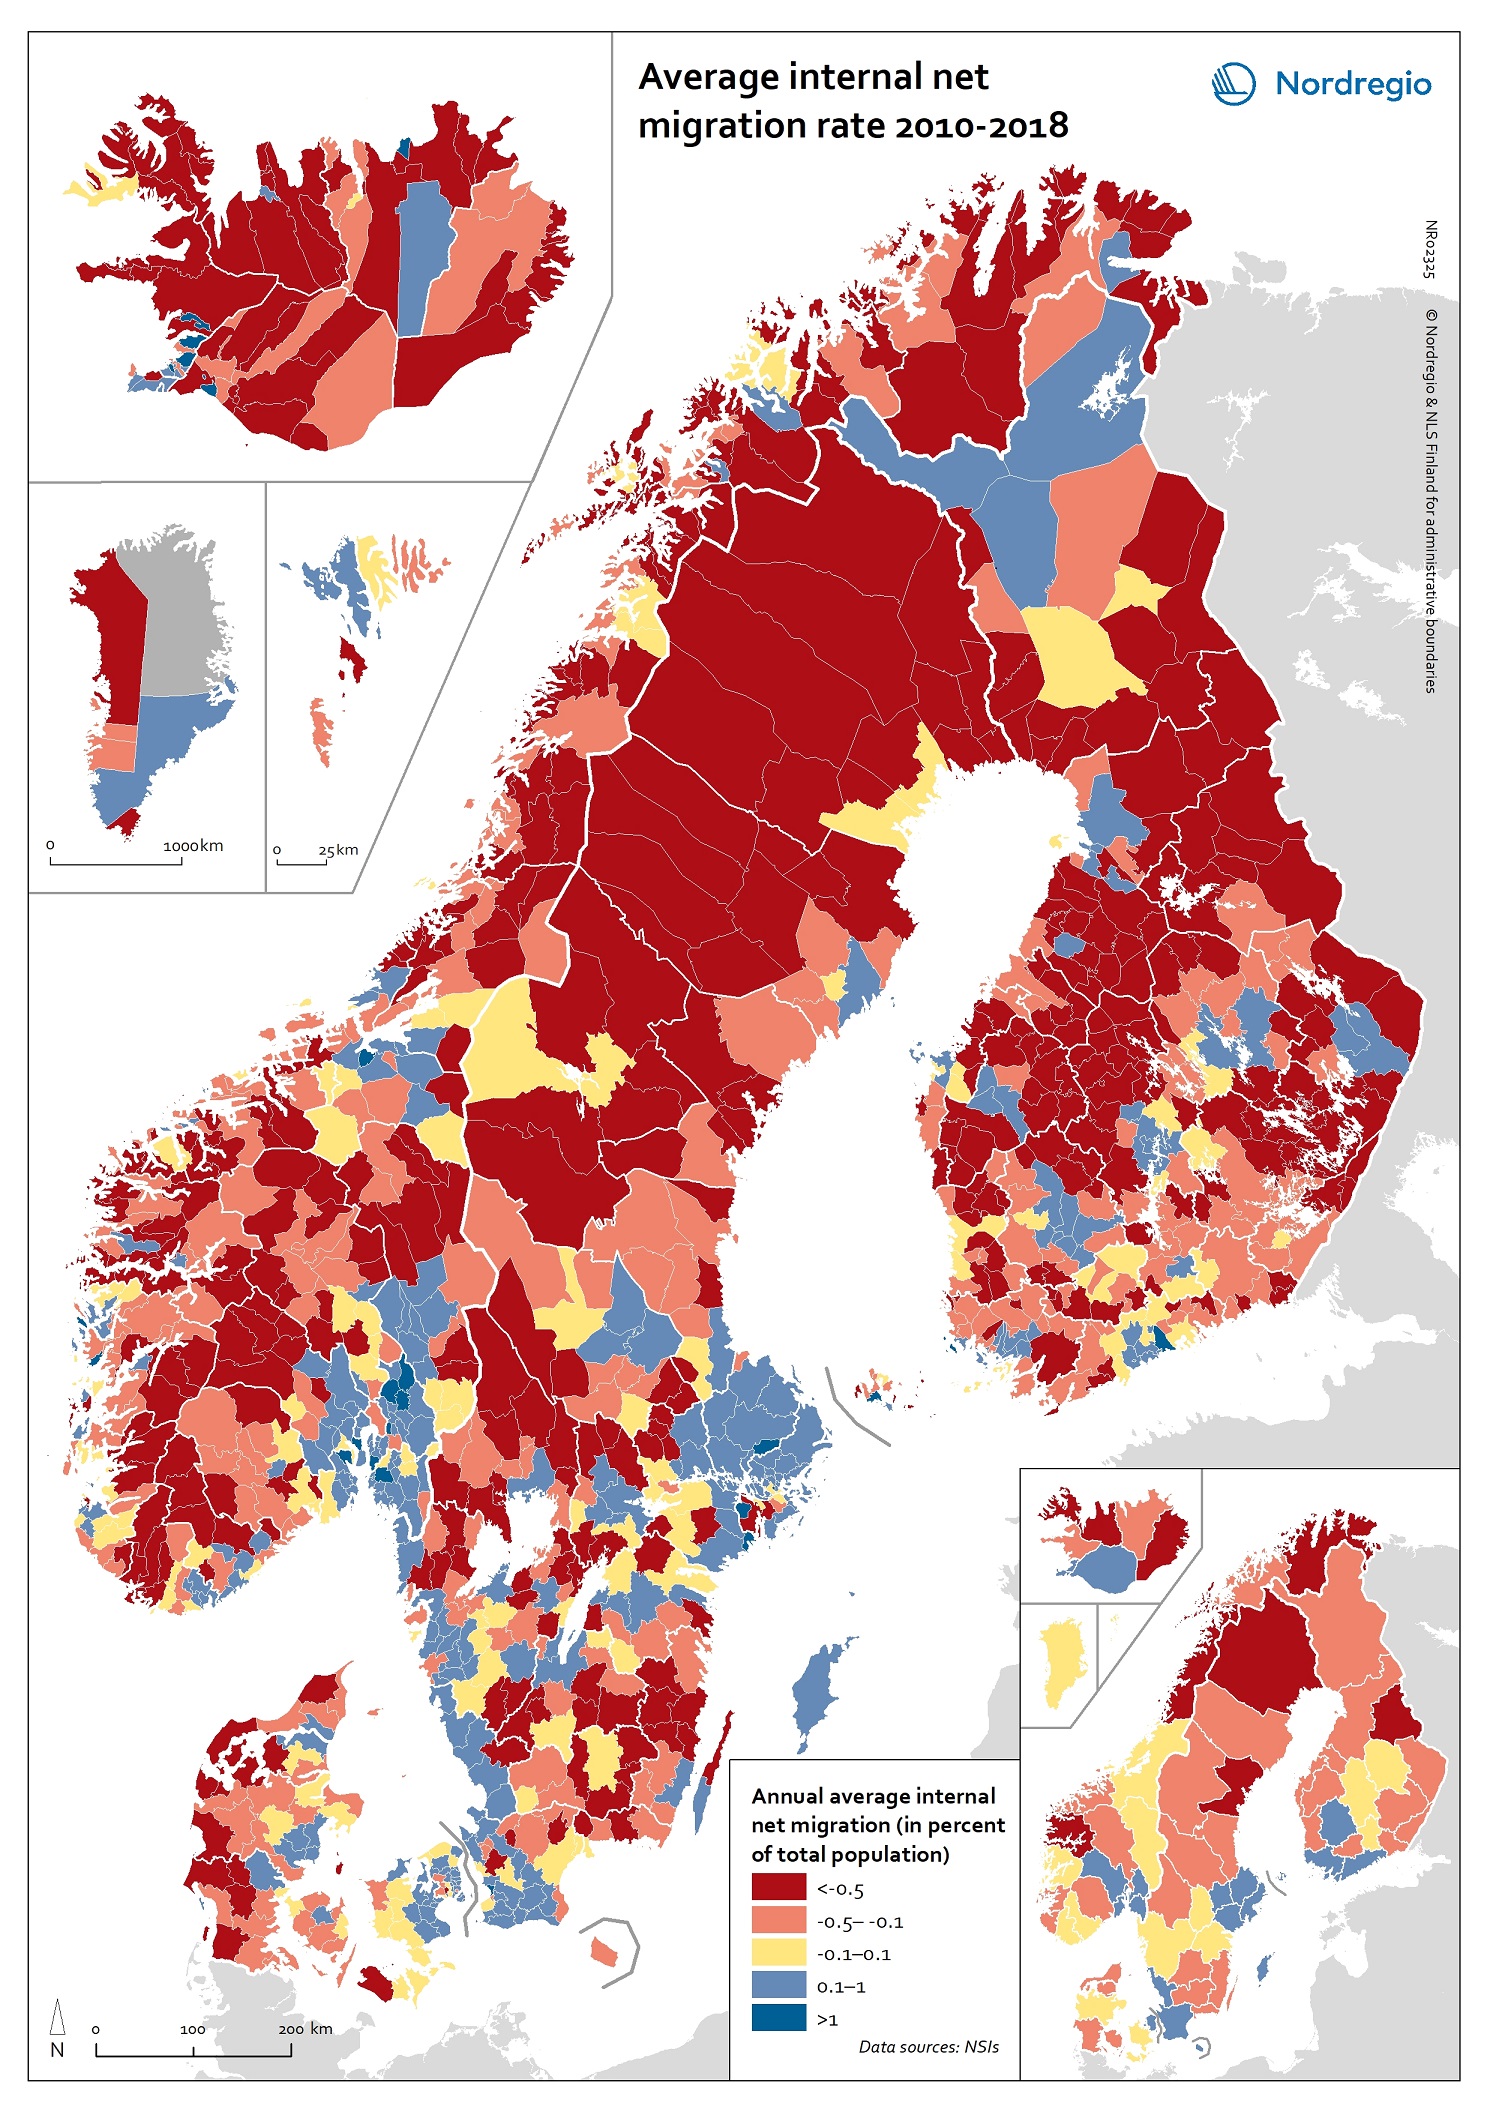
Net internal migration rate, 2010-2019
The map shows the annual average internal net migration in 2010-2019. The map is related to the same map showing net internal migration in 2020. The maps show several interesting patterns, suggesting that there may be an increasing trend towards urban-to-rural countermigration in all the five Nordic countries because of the pandemic. In other words, there are several rural municipalities – both in sparsely populated areas and areas close to major cities – that have experienced considerable increases in internal net migration. In Finland, for instance, there are several municipalities in Lapland that attracted return migrants to a considerable degree in 2020 (e.g., Kolari, Salla, and Savukoski). Swedish municipalities with increasing internal net migration include municipalities in both remote rural regions (e.g., Åre) and municipalities in the vicinity of major cities (e.g., Trosa, Upplands-Bro, Lekeberg, and Österåker). In Iceland, there are several remote municipalities that have experienced a rapid transformation from a strong outflow to an inflow of internal migration (e.g., Ásahreppur, Tálknafjarðarhreppurand, and Fljótsdalshreppur). In Denmark and Norway, there are also several rural municipalities with increasing internal net migration (e.g., Christiansø in Denmark), even if the patterns are somewhat more restrained compared to the other Nordic countries. Interestingly, several municipalities in capital regions are experiencing a steep decrease in internal migration (e.g., Helsinki, Espoo, Copenhagen and Stockholm). At regional level, such decreases are noted in the capital regions of Copenhagen, Reykjavík and Stockholm. At the same time, the rural regions of Jämtland, Kalmar, Sjælland, Nordjylland, Norðurland vestra, Norðurland eystra and Kainuu recorded increases in internal net migration. While some of the evolving patterns of counterurbanisation were noted before 2020 for the 30–40 age group, these trends seem to have been strengthened by the pandemic. In addition to return migration, there may be a larger share of young adults who…
- 2022 March
- Demography
- Migration
- Nordic Region
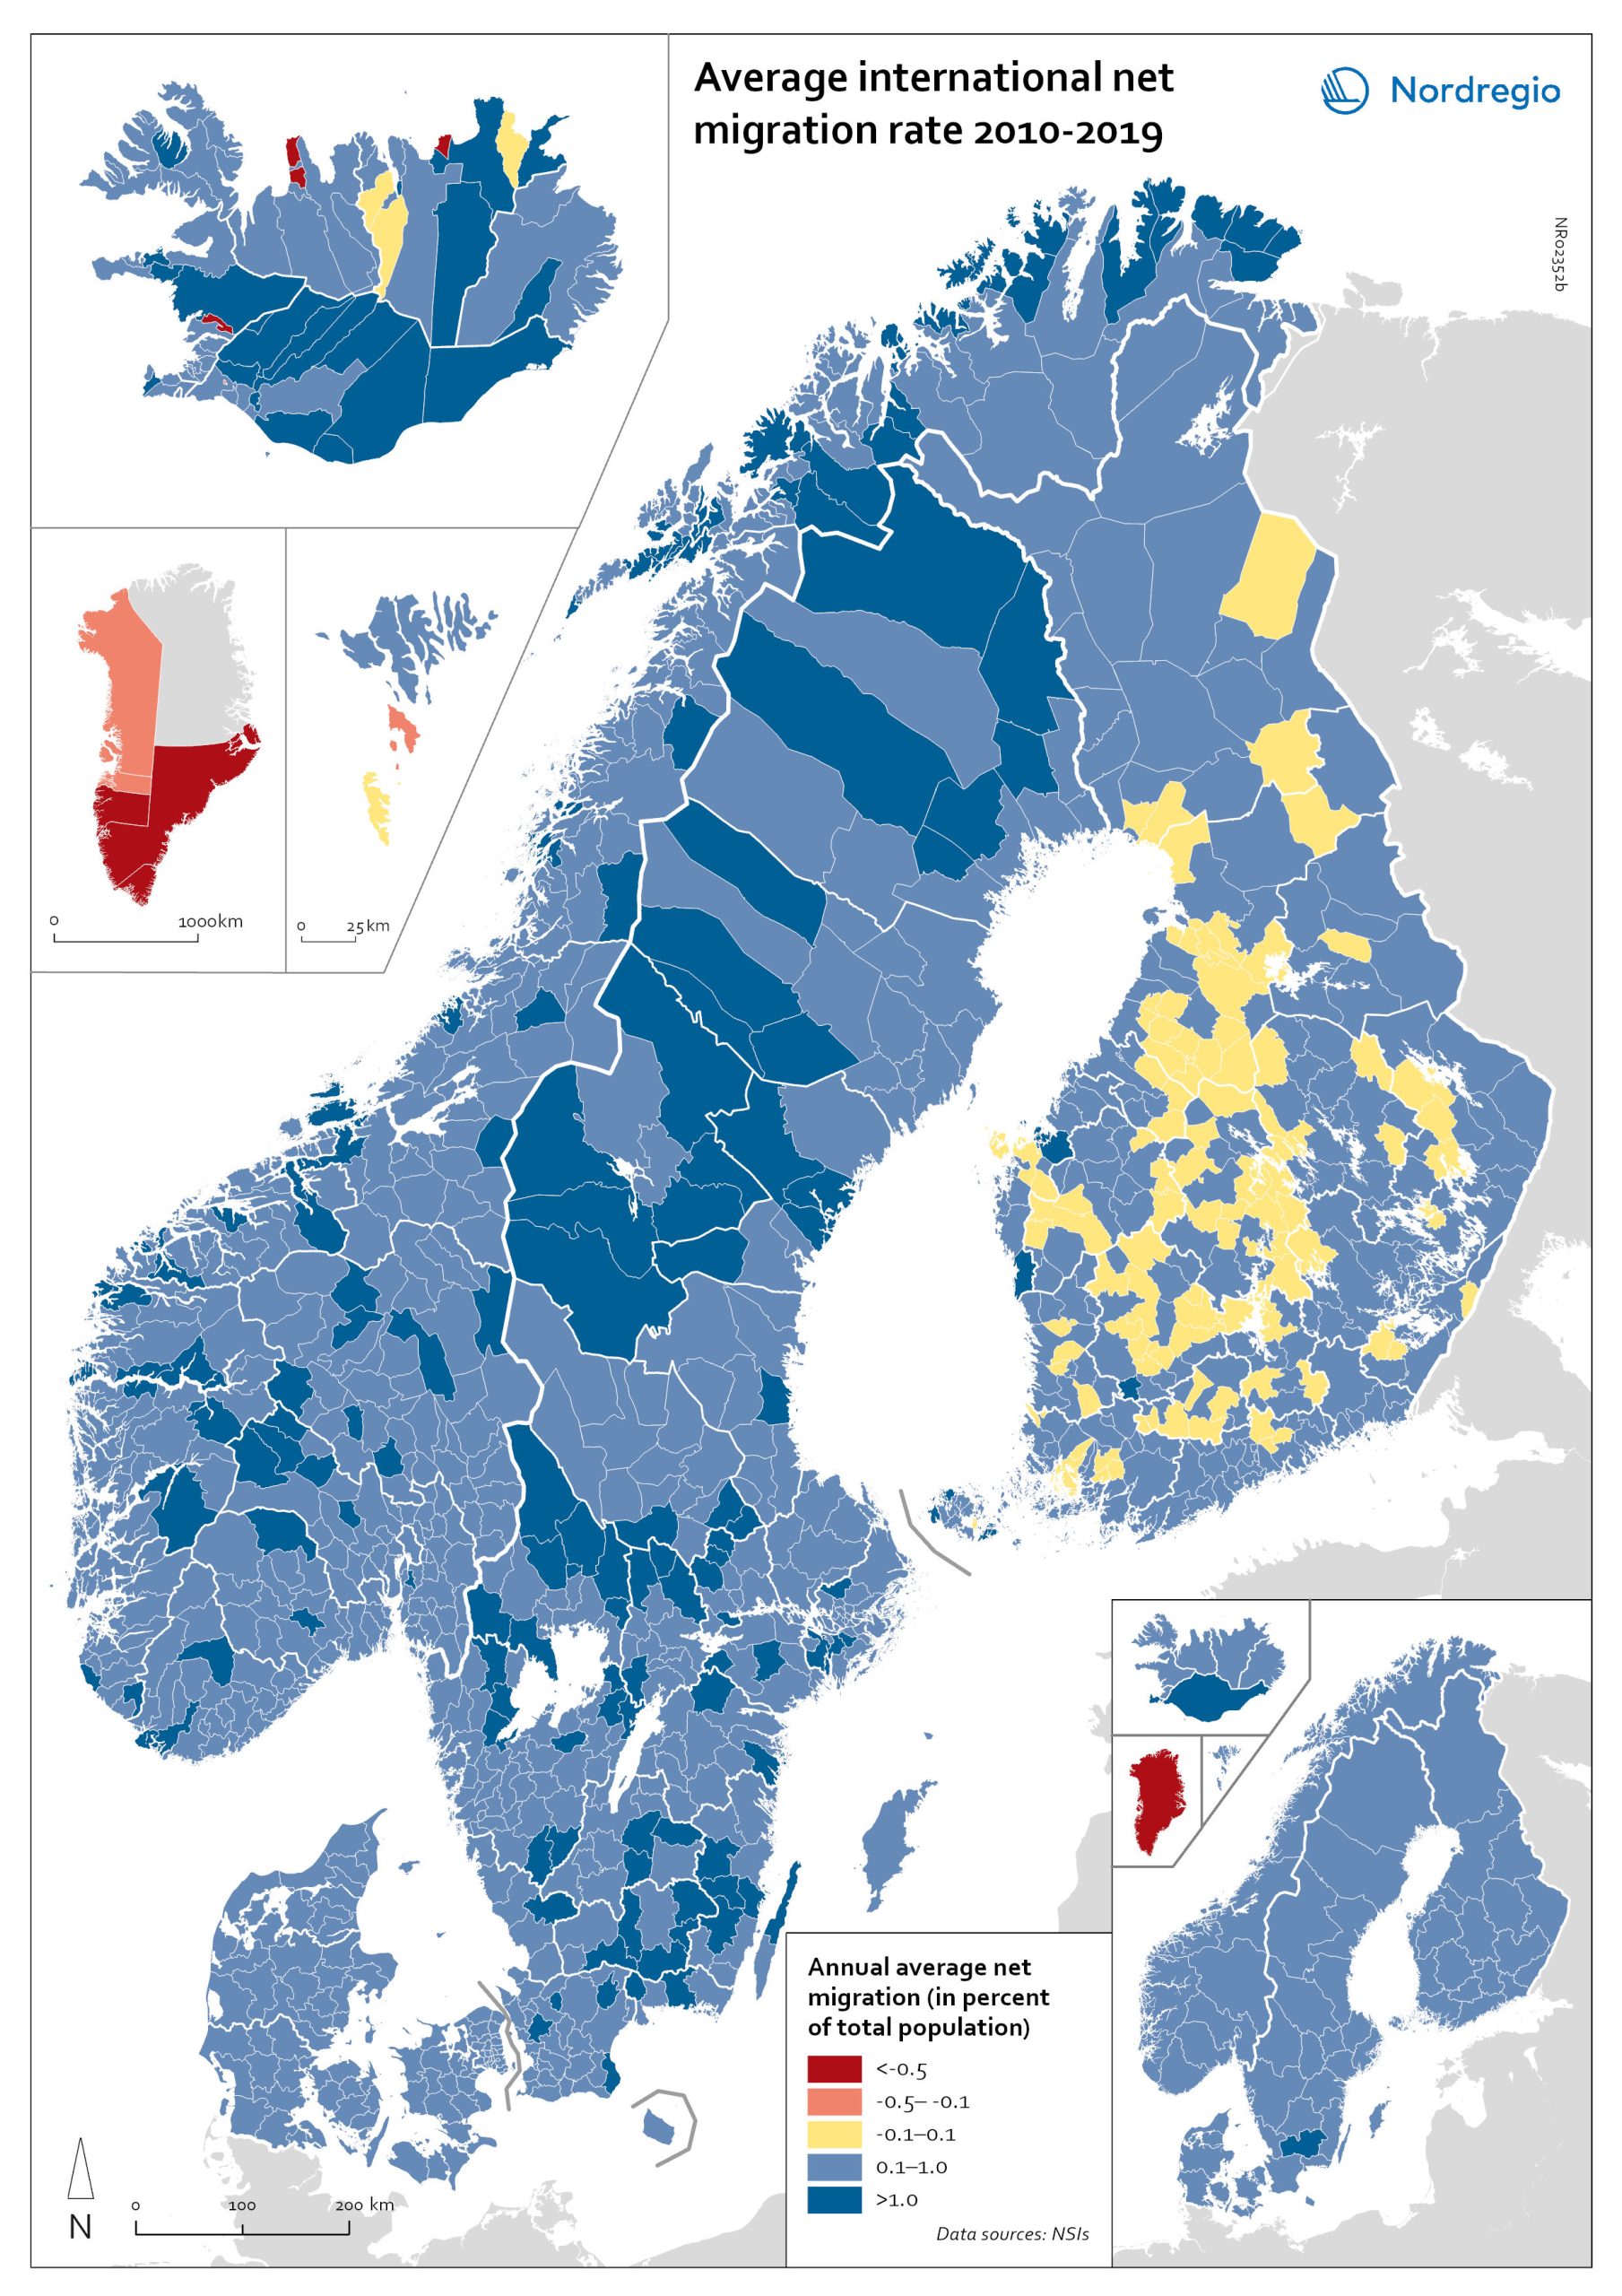
Net international migration rate, 2010–2019
The map shows the annual average international net migration from 2010 to 2019. The map is related to the same map showing net migration in 2020. At regional level, there are only minor changes between the net migration in 2010-2019 and 2020. All regions of Norway, all regions of Sweden except Gotland and Uppsala, and the regions of Österbotten in Finland, Midtjylland in Denmark and Norðurland eystra in Iceland experienced a slight decrease in international net migration I 2020 compared to 2010-2019. There is a more marked increase in net migration in the Faroe Islands, Greenland and the region of Norðurland vestra in Iceland, and a slight increase in the region of Austurland in Iceland. At municipal level, the maps show more changing patterns. In Denmark, Norway and Sweden, several municipalities – both in the capital, intermediate, and rural regions – had lower levels of international net migration in 2020 compared to 2010-2019. In Iceland and Finland, the picture is more balanced, with some municipalities showing a decrease, others an increase. In the Faroe Islands and Greenland, several municipalities/regions had an increase in international net migration.
- 2022 March
- Demography
- Migration
- Nordic Region
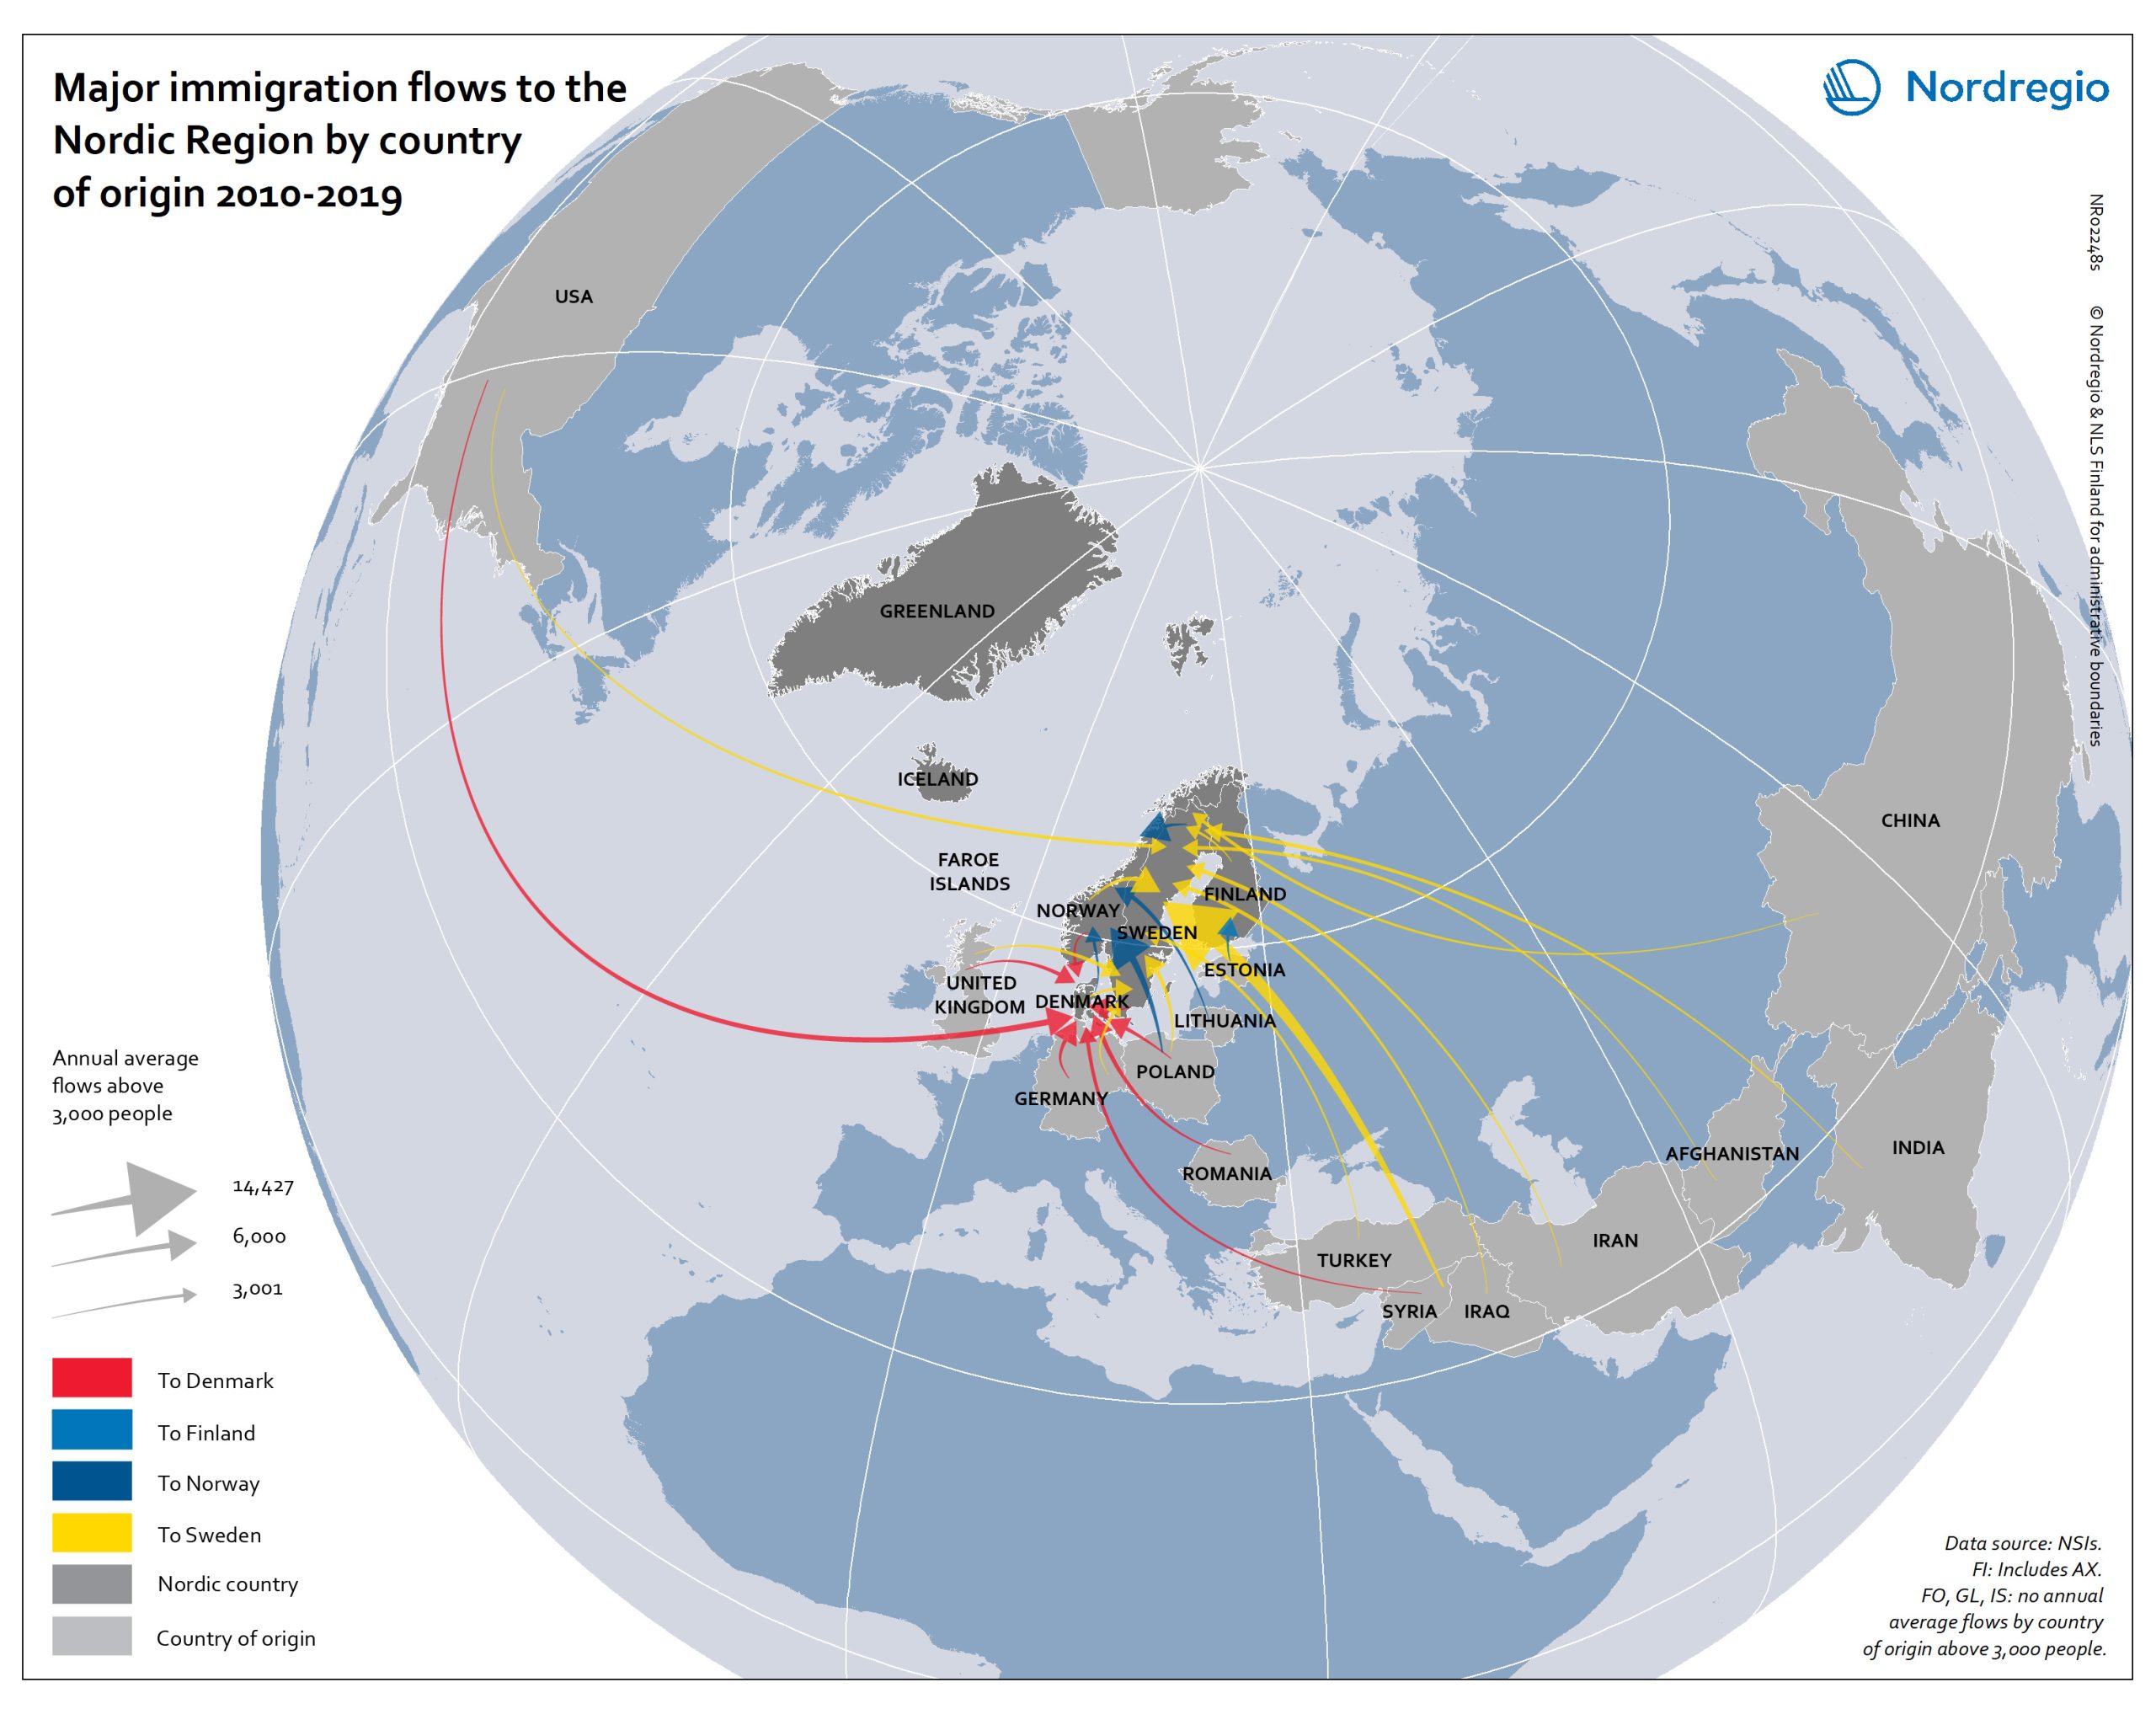
Major immigration flows to the Nordic Region from 2010 to 2019
The map shows annual average immigration flows above 3,000 people, and the growing diversity in their countries of origin Sweden and Denmark, in particular, experienced large inflows from non-Nordic countries during the period 2010-2019, with Sweden standing out as the Nordic country with by far the largest immigrant in-flows. A large portion of these arrivals were from war-torn Syria (an annual average of almost 15,000), followed by Poland (approximately 4,500), United Kingdom, Iraq, India and Iran (around 4,000 each). Denmark experienced a smaller number of inflows above 3,000 people, compared to Sweden. The largest non-Nordic inflows to Denmark were around 5,000 people (per sending country) and included migrants from the U.S., Germany, Romania and Poland. For Norway, large non-Nordic in-flows were limited to Lithuania and Poland. Similarly, Finland had only one major inflow, from Estonia.
- 2021 December
- Migration
- Nordic Region
Change in share of biofuels in transport from 2010 to 2018
This map shows change in share of biofuels in final energy consumption in transport in the Nordic Arctic and Baltic Sea Region from 2010 to 2018. Even though a target for greater use of biofuels has been EU policy since the Renewable Energy and Fuel Quality Directives of 2009, development has been slow. The darker shades of blue on the map represent higher increase, and the lighter shades of blue reflect lower increase. The lilac color represent decrease. The Baltic Sea represents a divide in the region, with countries to the north and west experiencing growth in the use of biofuels for transport in recent years. Sweden stands out (16 per cent growth), while the other Nordic countries has experienced more modest increase. In the southern and eastern parts of the region, the use of biofuels for transport has largely stagnated. Total biofuel consumption for transport has risen more than the figure indicates due to an increase in transport use over the period.
- 2021 December
- Arctic
- Baltic Sea Region
- Nordic Region
- Transport
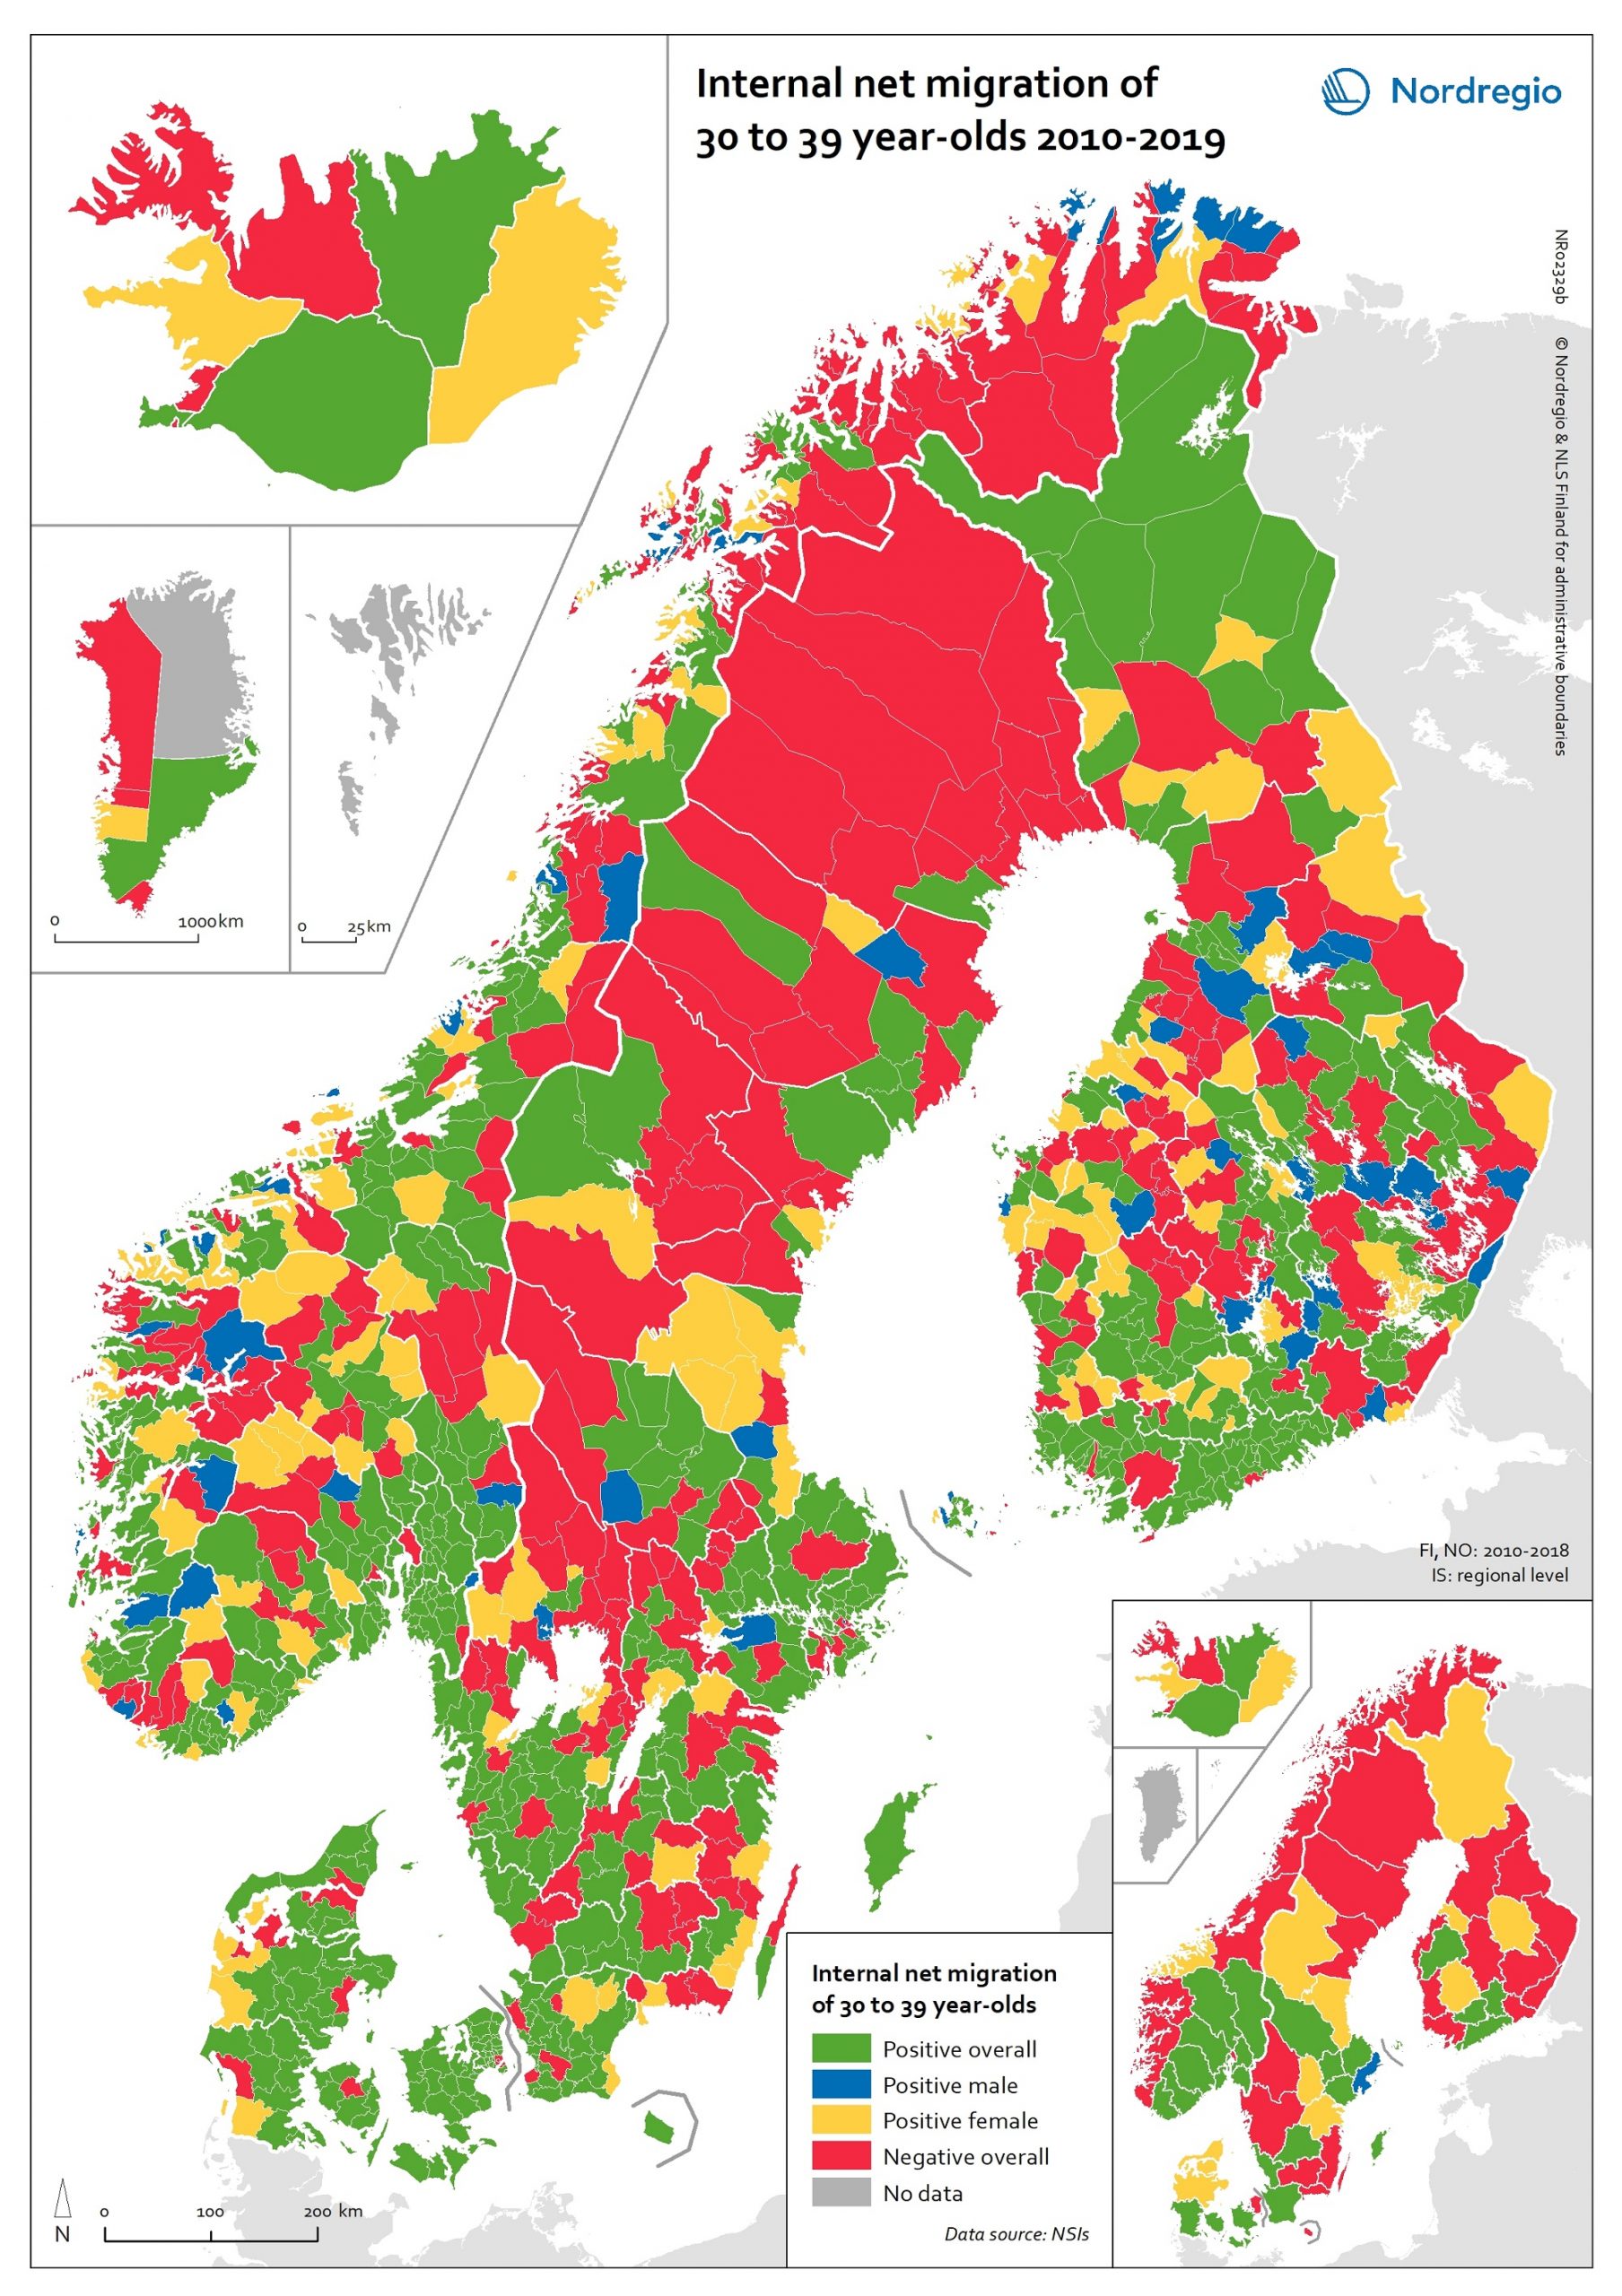
Internal net migration of 30 to 39 years-of-age, by gender, in 2010-2019
This map shows a typology that divides the Nordic municipalities and regions into four migration categories: positive net migration for both males and females (green on the map), positive male net migration (blue on the map), positive female net migration (yellow on the map), and negative net migration for both males and females (red on the map). These migration flows on 30 to 39-year-olds are of particular interest since it is often assumed that the future of rural regions is dependent upon their capability both to retain their populations and to attract newcomers, returning residents and second home owners. In this context, the map provides a rather positive picture, because a considerable proportion of rural municipalities have experienced positive net migration among females, males, or both sexes across all the Nordic countries. Even so, there is negative net migration among both females and males in many municipalities in northern Sweden, north-eastern Norway and eastern Finland, in addition to several inland municipalities within these countries. Interestingly, there is negative net migration among both sexes across all the capital city municipalities of the Nordic Region. According to the regional map, the capital city regions of Denmark, Iceland and Norway all experienced negative net migration of young people aged 30-39 years between 2010 and 2019. The capital city region of Sweden experienced positive net migration of males and negative net migration of females while the capital city region of Finland experienced positive net migration overall. Despite the majority of peripheral regions experiencing negative net migration of 30 to 39-year-olds during the time period studied, there are also several interesting examples of rural regions which experienced positive female net migration, for example Nordjylland (Denmark), Pohjois-Savo (Finland), Austurland (Iceland), Møre og Romsdal (Norway), and Jämtland (Sweden).
- 2020 October
- Demography
- Migration
- Nordic Region
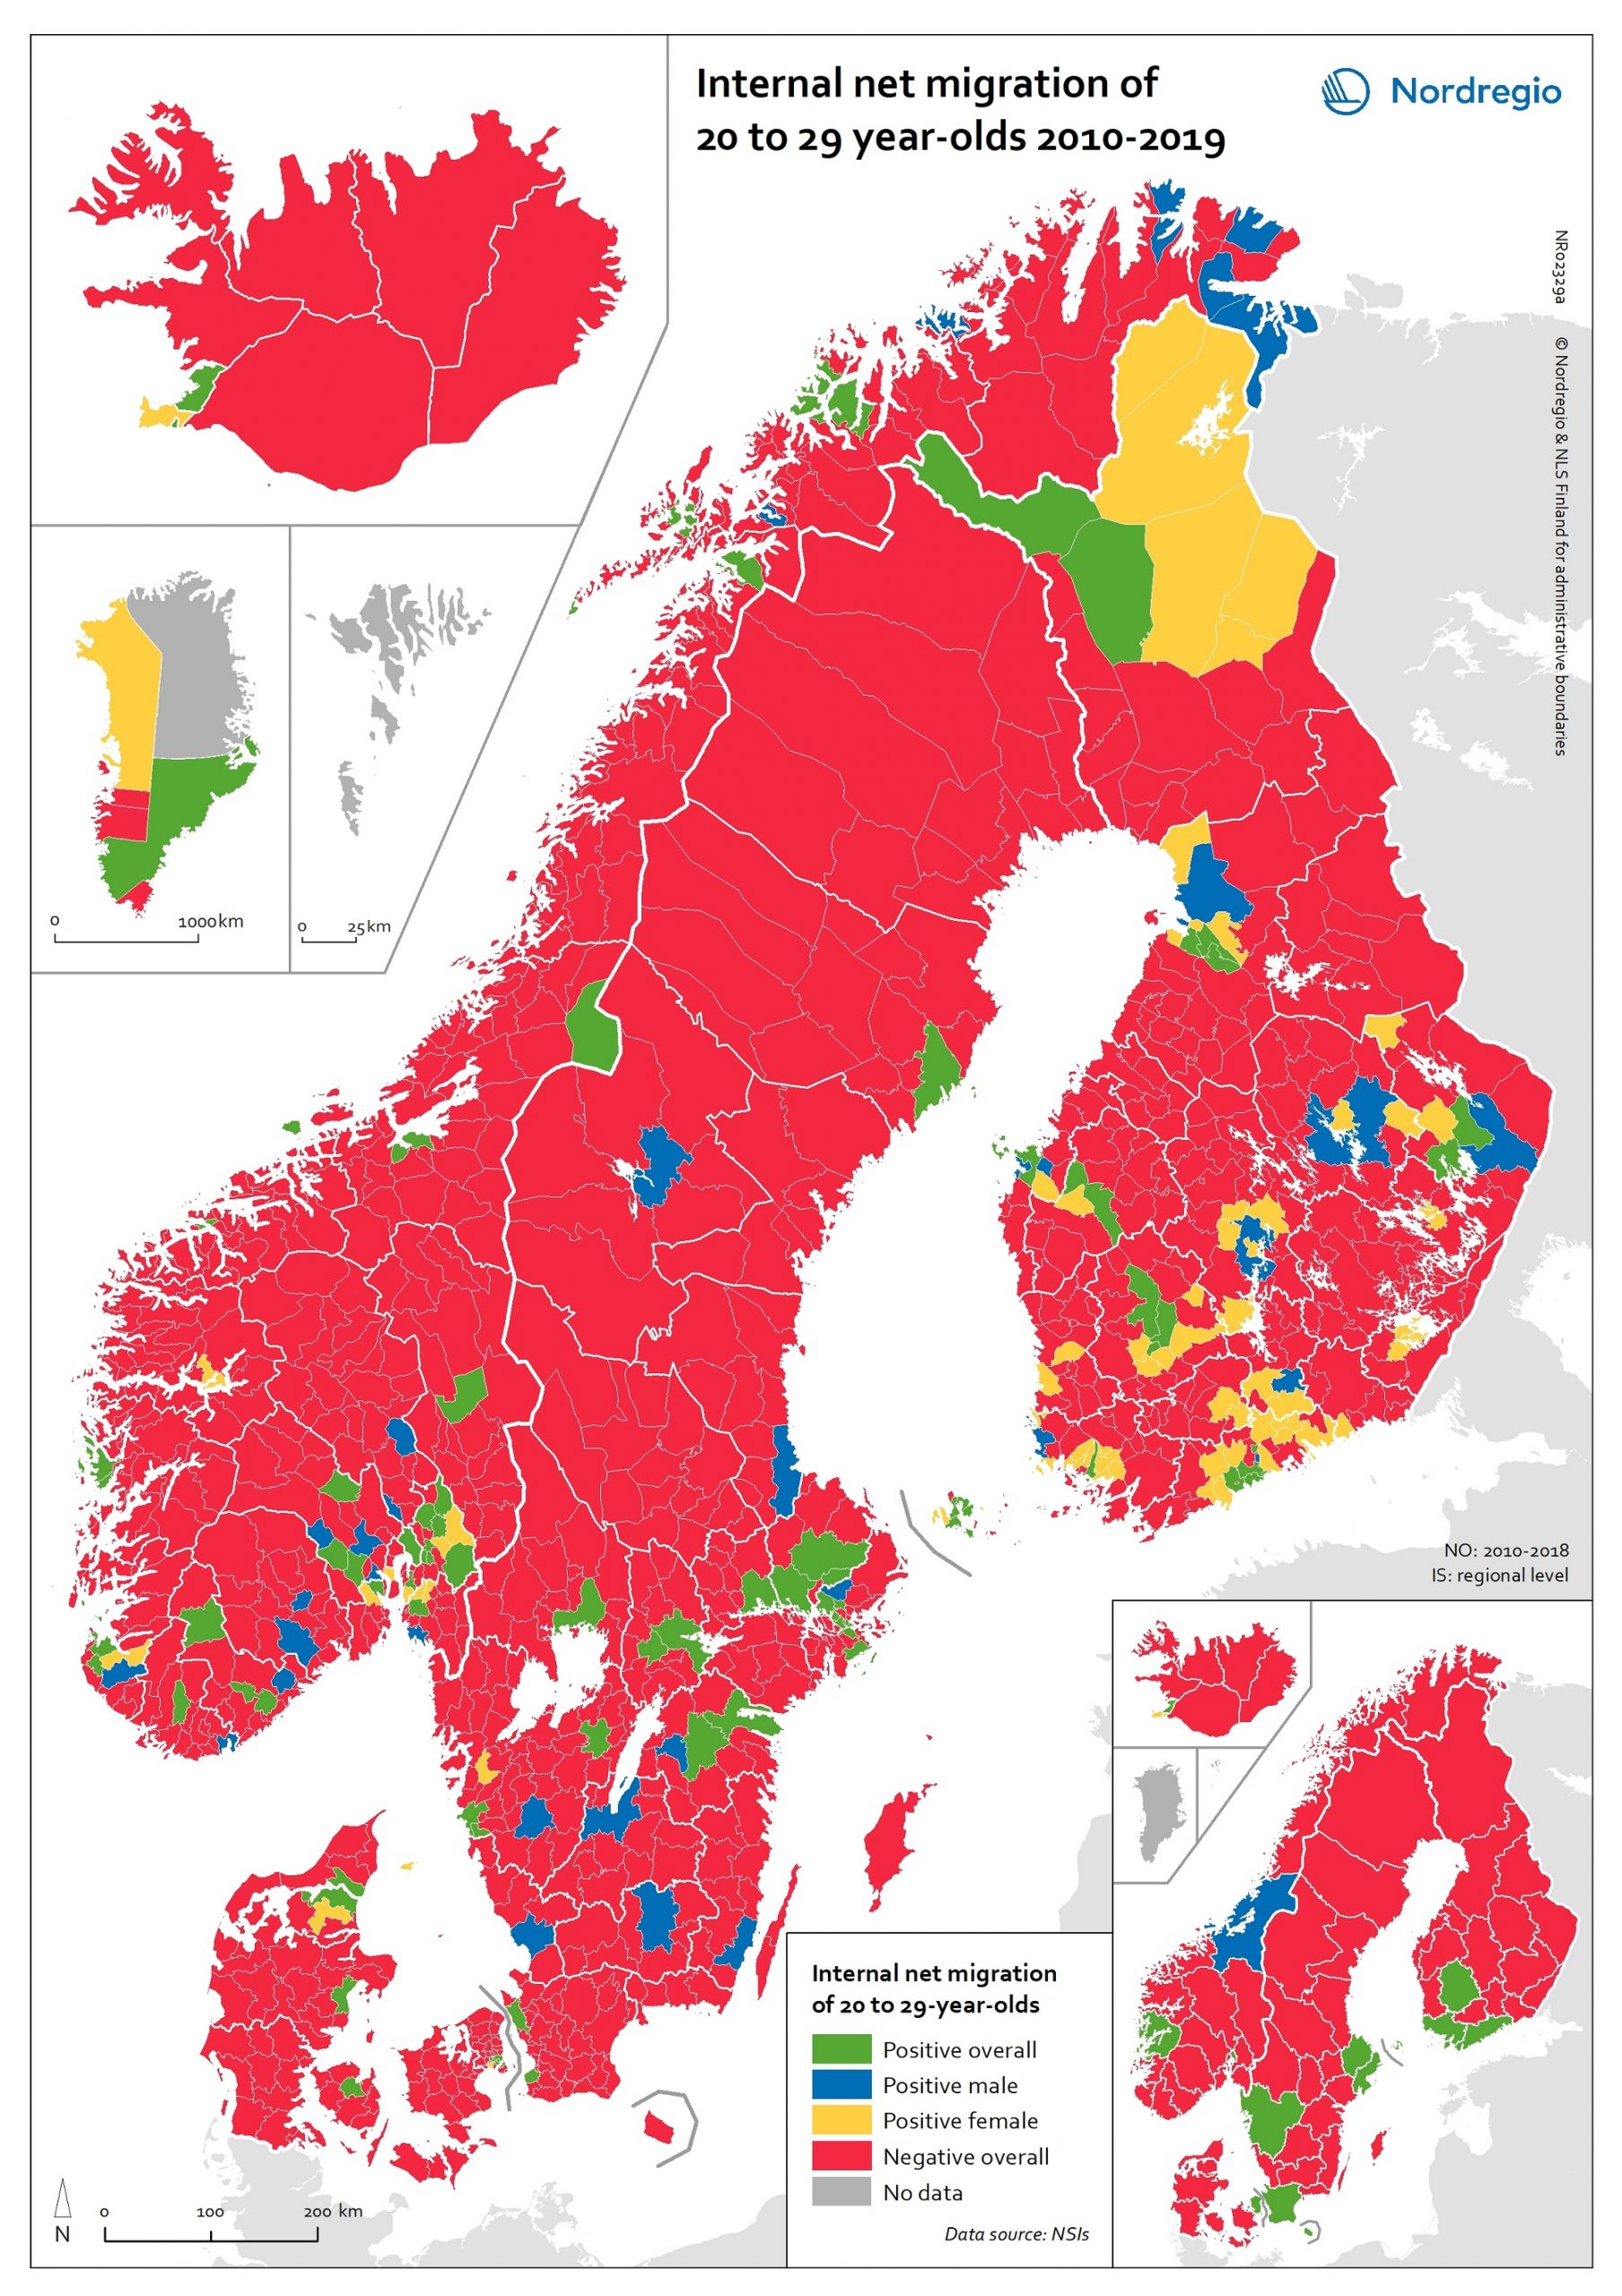
Internal net migration of 20 to 29 years-of-age, by gender, in 2010-2019
This map shows a typology that divides the Nordic municipalities and regions into four migration categories: positive net migration for both males and females (green on the map), positive male net migration (blue on the map), positive female net migration (yellow on the map), and negative net migration for both males and females (red on the map). These migration flows of 20 to 29-year-olds are of interest since there is a particularly high level of internal migration among young adults across the Nordic countries compared to other EU countries. While the map shows that the great majority of municipalities experience negative net migration of young adults in favour of a few functional urban areas and some larger towns, it is possible to observe a number of exceptions to this general rule. The rural municipalities of Utsira, Moskenes, Valle, Smøla, Ballangen and Lierne in Norway have the highest positive net migration rates both for men and women. There are also positive net migration rates for males and females in the peripheral municipalities of Jomala, Kittilä, Lemland and Finström in Finland and Åland. There is positive male net migration but negative female net migration in Gratangen, Loppa, Gamvik, Drangedal and a few other Norwegian rural municipalities, plus Mariehamn in Åland, while several municipalities in remote areas of Finland have positive female net migration but negative male net migration. Some of these patterns may be related to specialised local labour markets, such as fisheries in Loppa, or recreational tourism in Kittilä. In general, the pattern of net migration among young adults is more diverse in Finland (where 72.0% of all municipalities have negative net migration), compared with 84.6% in Norway, 88.9% in Denmark and 89.0% in Sweden. However, it is important to remember that Danish, Finnish and Norwegian municipalities are smaller in size…
- 2020 October
- Demography
- Migration
- Nordic Region
Internal net migration as percentage of population 2010–2018
This map shows annual average internal net migration rate at the municipal and regional level in 2010-2018. The map shows the percentage change from internal migration for the period 2010 to 2018. Internal or domestic migration refers to migration between municipalities and regions within the same country. The blue areas on the map show municipalities/regions with positive internal net migration (i.e. more people arriving than departing), the red areas show municipalities/regions with negative internal net migration (i.e. more people departing than arriving) and the yellow areas show municipalities/regions with balanced internal net migration rates (i.e. comparable numbers of people arriving and departing). The trend revealed is that internal migration movements are directed towards larger city regions, with many rural periphery regions losing people. The loss of people in some of these regions is felt especially acutely because of the age selectivity of migration, with young people leaving in large numbers, accelerating the ageing of the population structure in regions with high out-migration. Read the digital publication here.
- 2020 February
- Demography
- Migration
- Nordic Region
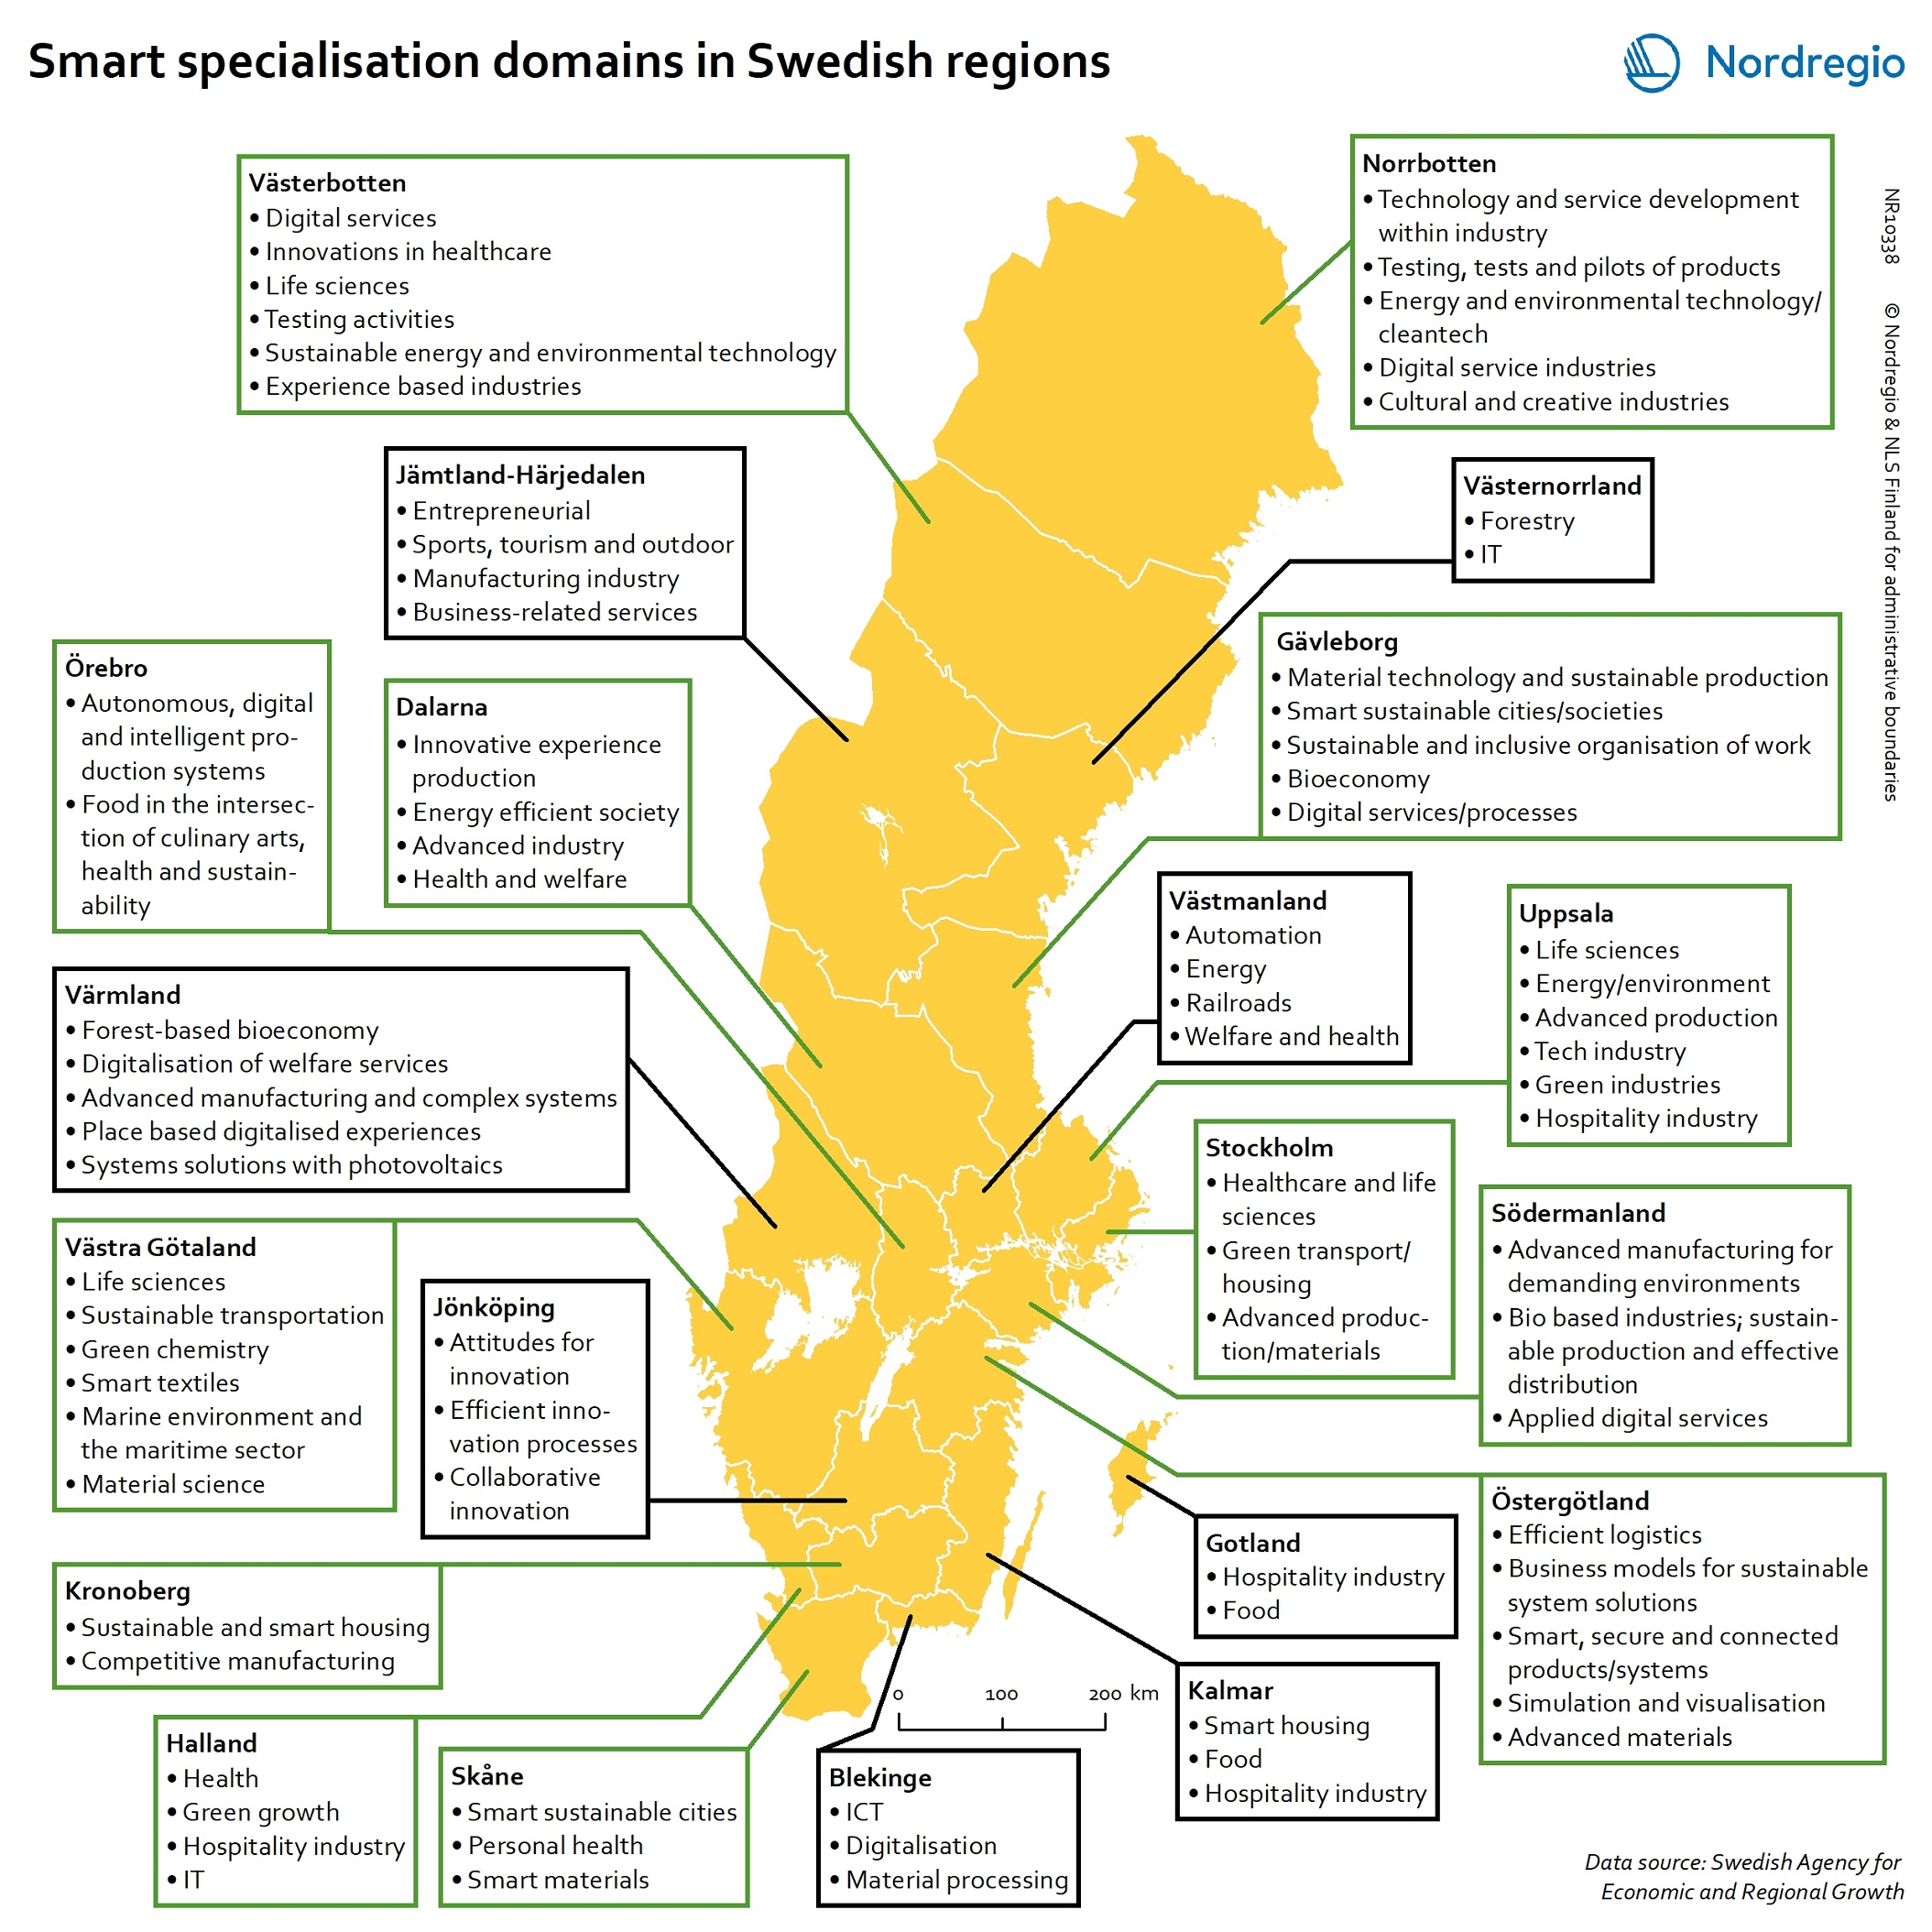
Smart specialisation domains in Swedish regions
This map gives an overview of the S3 focus areas in the Swedish regions in 2019. The major S3 domains in Sweden shown in the map provide a good overview of the key specialisation areas in Sweden. It is possible, for example, to check which Swedish regions have “green”, “sustainable”, “environment” at their smart specialisation domains (marked in green in their respective infoboxes for the domains in the figure). The information illustrated in the map can assist Swedish regions when they are considering opportunities for S3 synergy and co-operation with each other. In Sweden, the Swedish Agency for Economic and Regional Growth (Tillväxtverket) is a central actor in assisting regions in their work with smart specialisation. Tillväxtverket promotes opportunities for cooperation between the Swedish regional S3 processes and provides relevant information and learning seminars related to S3. Read the digital publication here.
- 2020 February
- Economy
- Research and innovation
- Sweden
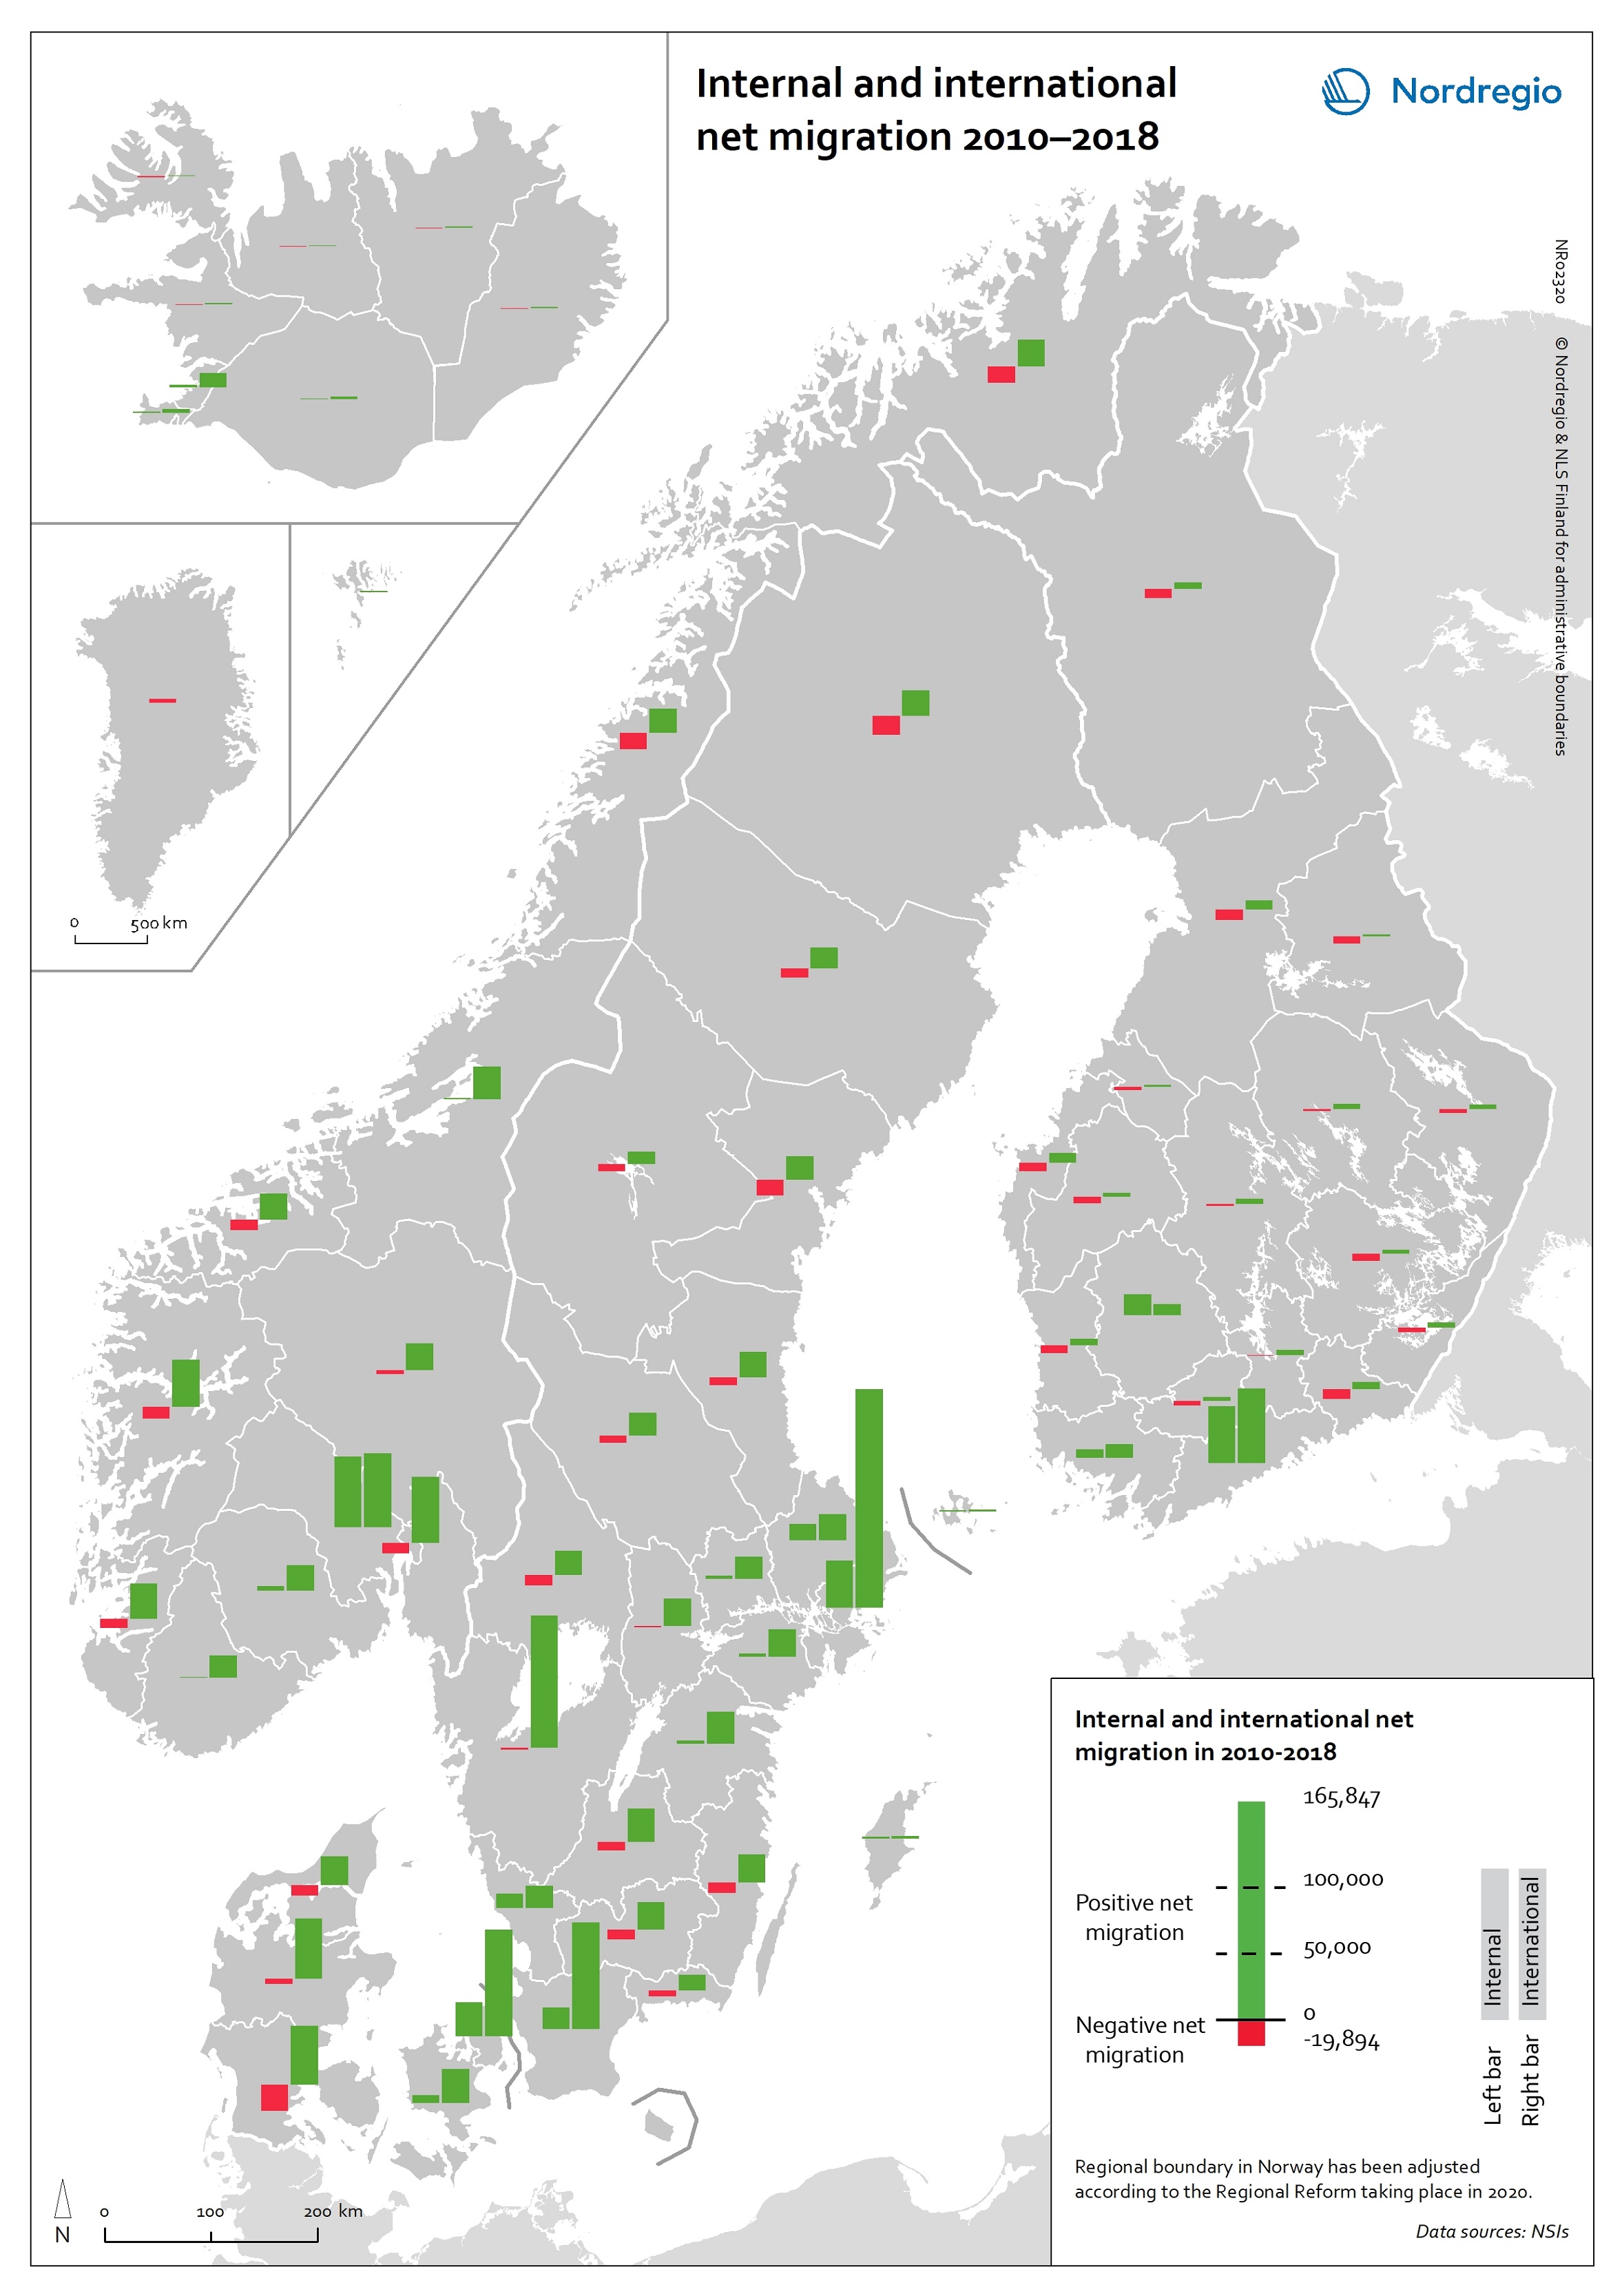
Internal and international net migration 2010-2018
This map shows internal and international net migration in 2010-2018. The map shows the combination of domestic migration (left-hand bar) and international migration (right-hand bar), with red indicating net out-migration and green indicating net in-migration, for the 66 regions within the Nordic Region in the period 2010 to 2018. The size of the bar indicates the size of the net flows. All regions have had positive international migration since 2010, which is not surprising given the size of the international migration flows into the Nordic Region in recent years. Overall in the Nordic Region, there were either domestic migration losses and international migration gains or gains from people moving both from elsewhere in the country and from abroad. The gains from international migration far exceeded those of internal migration in almost all regions that experienced net gains from both streams. Due to these different patterns of internal and international migration, nearly all regions are becoming much more diverse in terms of the size of foreign-born populations. Read the digital publication here.
- 2020 February
- Demography
- Migration
- Nordic Region
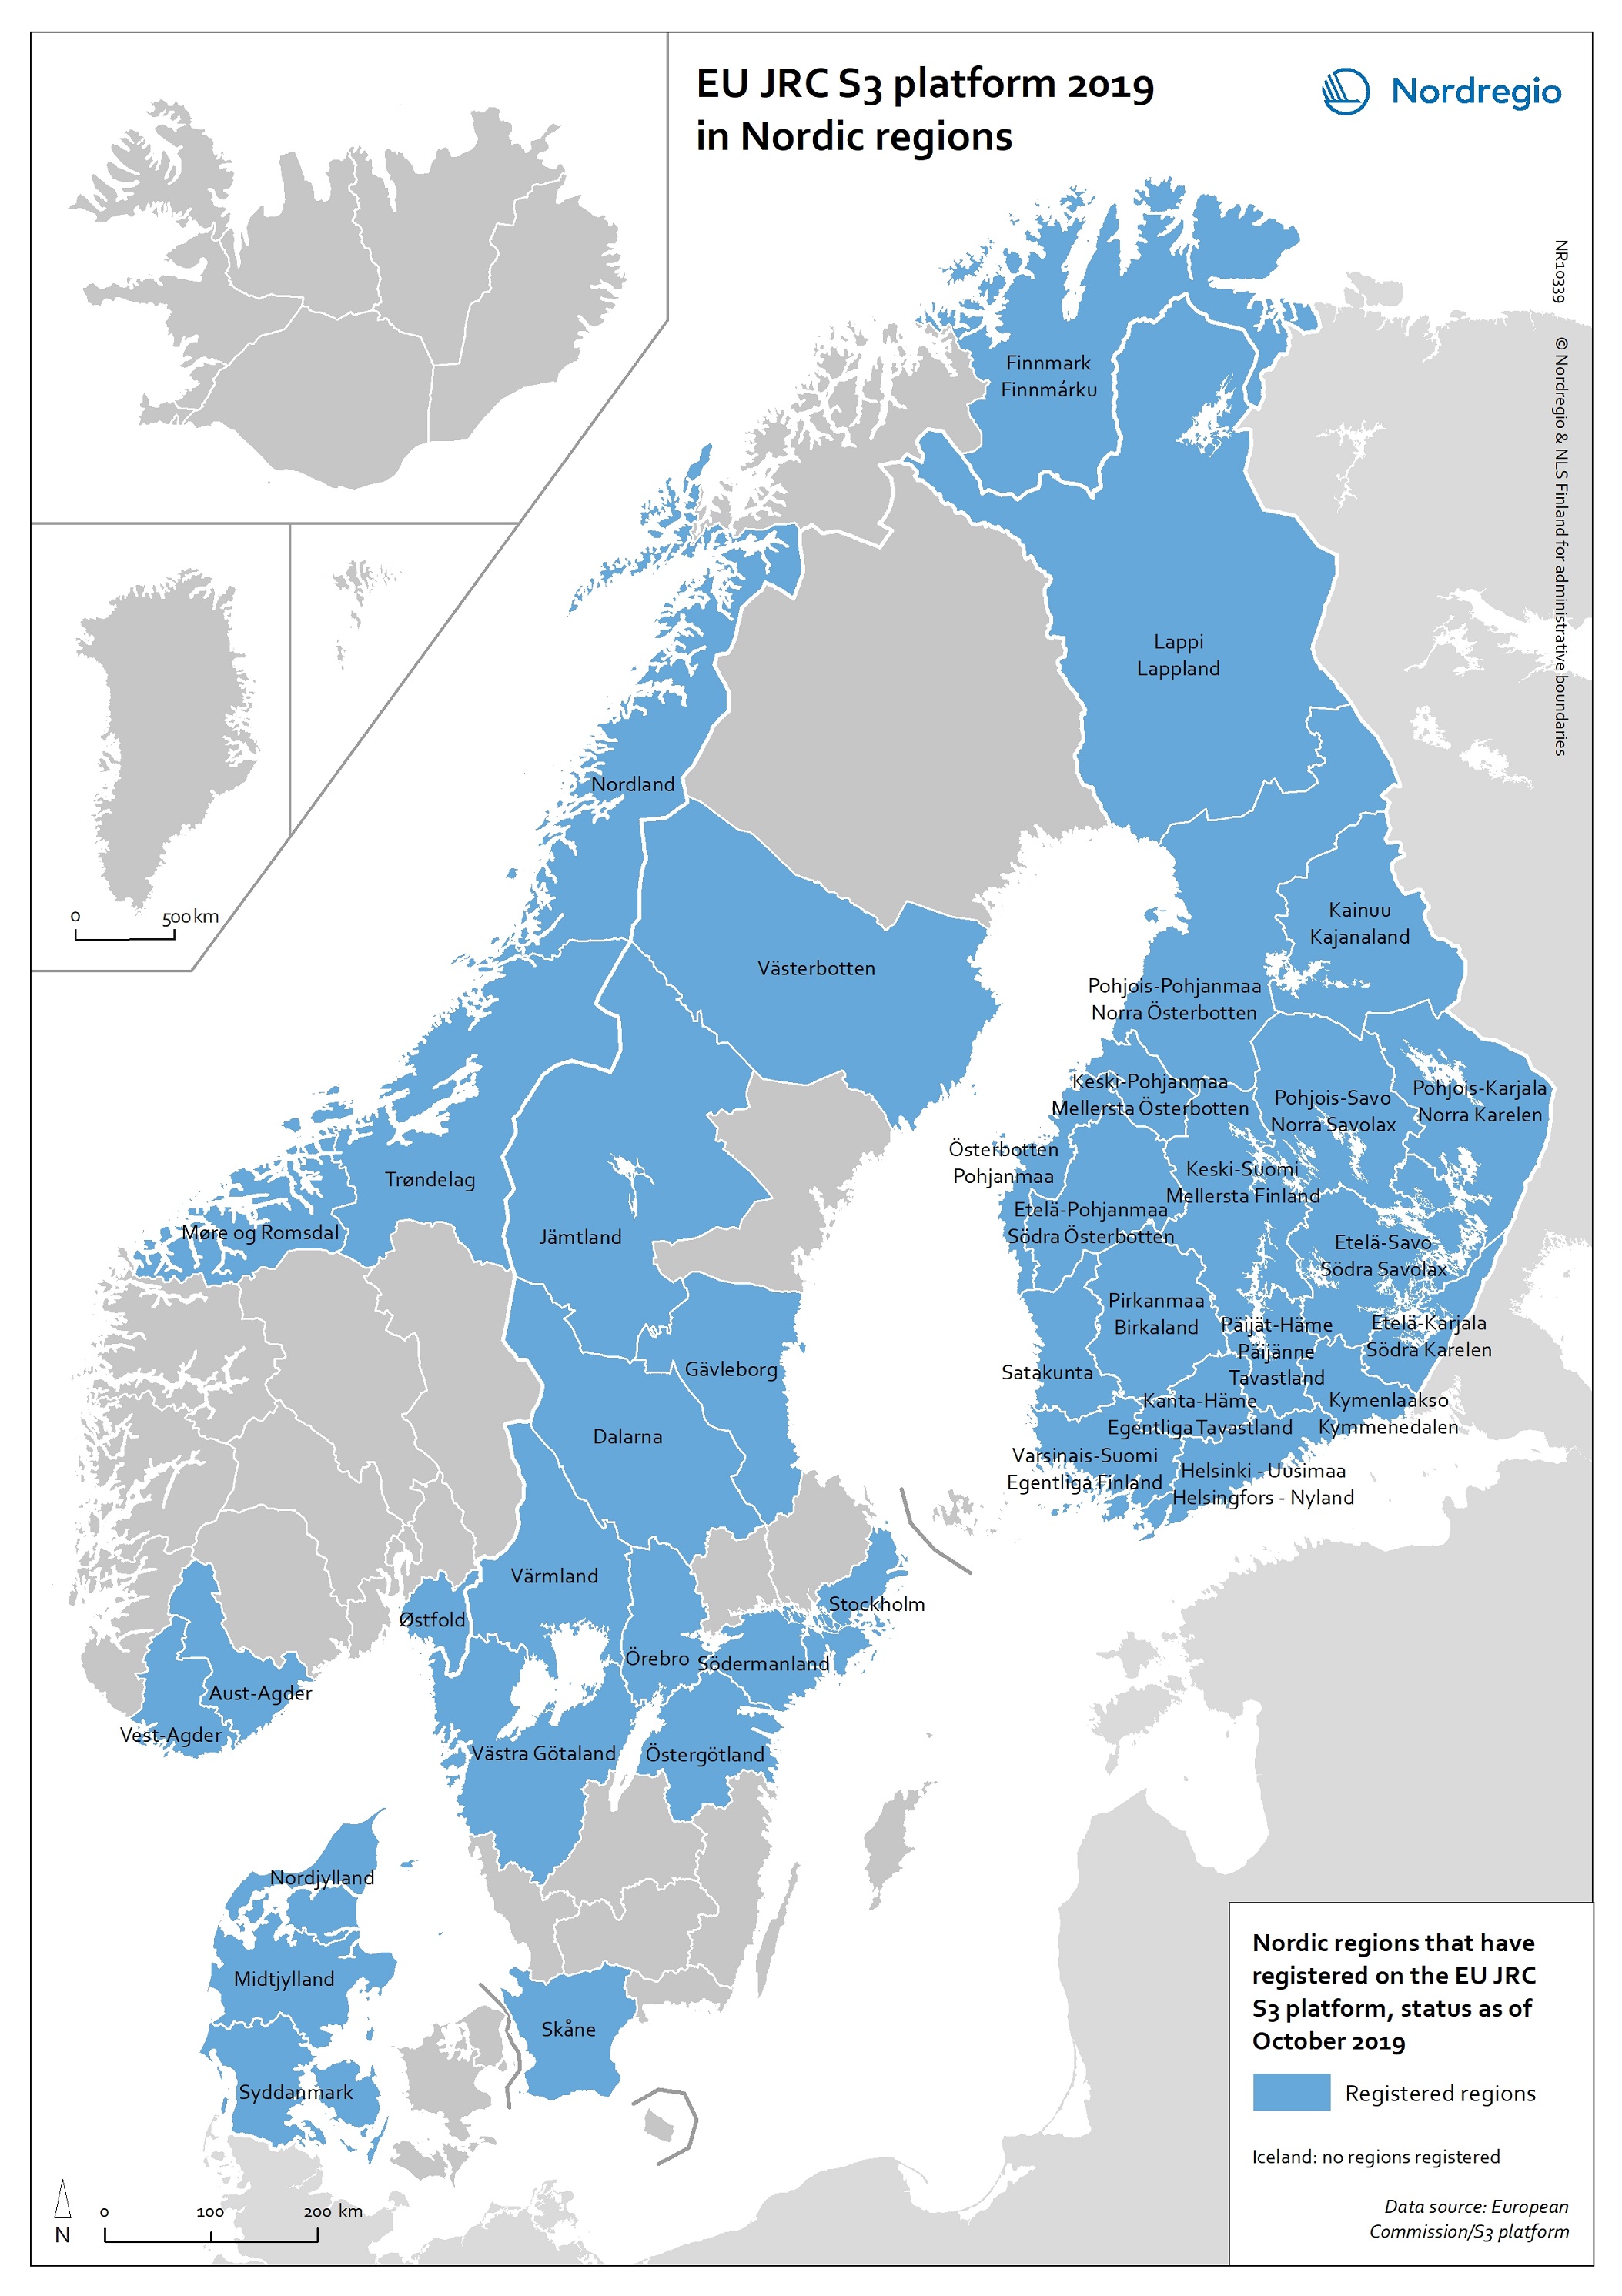
EU JRC S3 Platform 2019 in Nordic regions
This map shows the Nordic Regions that have registered on the EU JRC S3 platform, status as of October 2019. The regions that have registered on the S3 platform receive practical advice and broadened opportunities for international networking. In October 2019, there were 182 EU regions registered on the S3 platform, as well as 18 non-EU Member State regions. Of these regions, 38 are Nordic. It is worth noting that, as a non-EU member state, Norway has seven registered regions on the platform. Registration on the S3 platform is by no means a guarantee of success of a regional smart specialisation process, but it indicates the willingness of the region to learn more about S3 and to participate in international and interregional S3 cooperation through the possibilities provided by the S3 platform. The smart specialisation concept has been diffusing rapidly across Europe in the 2010s, as an increasing number of regions adopt it and design strategies departing from their own preconditions. The S3 platform in Seville, Spain, hosted by the Institute for Prospective Technological Studies (IPTS), was established in 2011 to assist EU countries and regions to develop, implement and review their smart specialisation strategies. The S3 platform provides information, methodologies, expertise and advice to national and regional policymakers, promotes mutual learning and transnational co-operation, and contributes to academic debates around the concept of smart specialisation. Read the digital publication here.
- 2020 February
- Economy
- Nordic Region
- Research and innovation
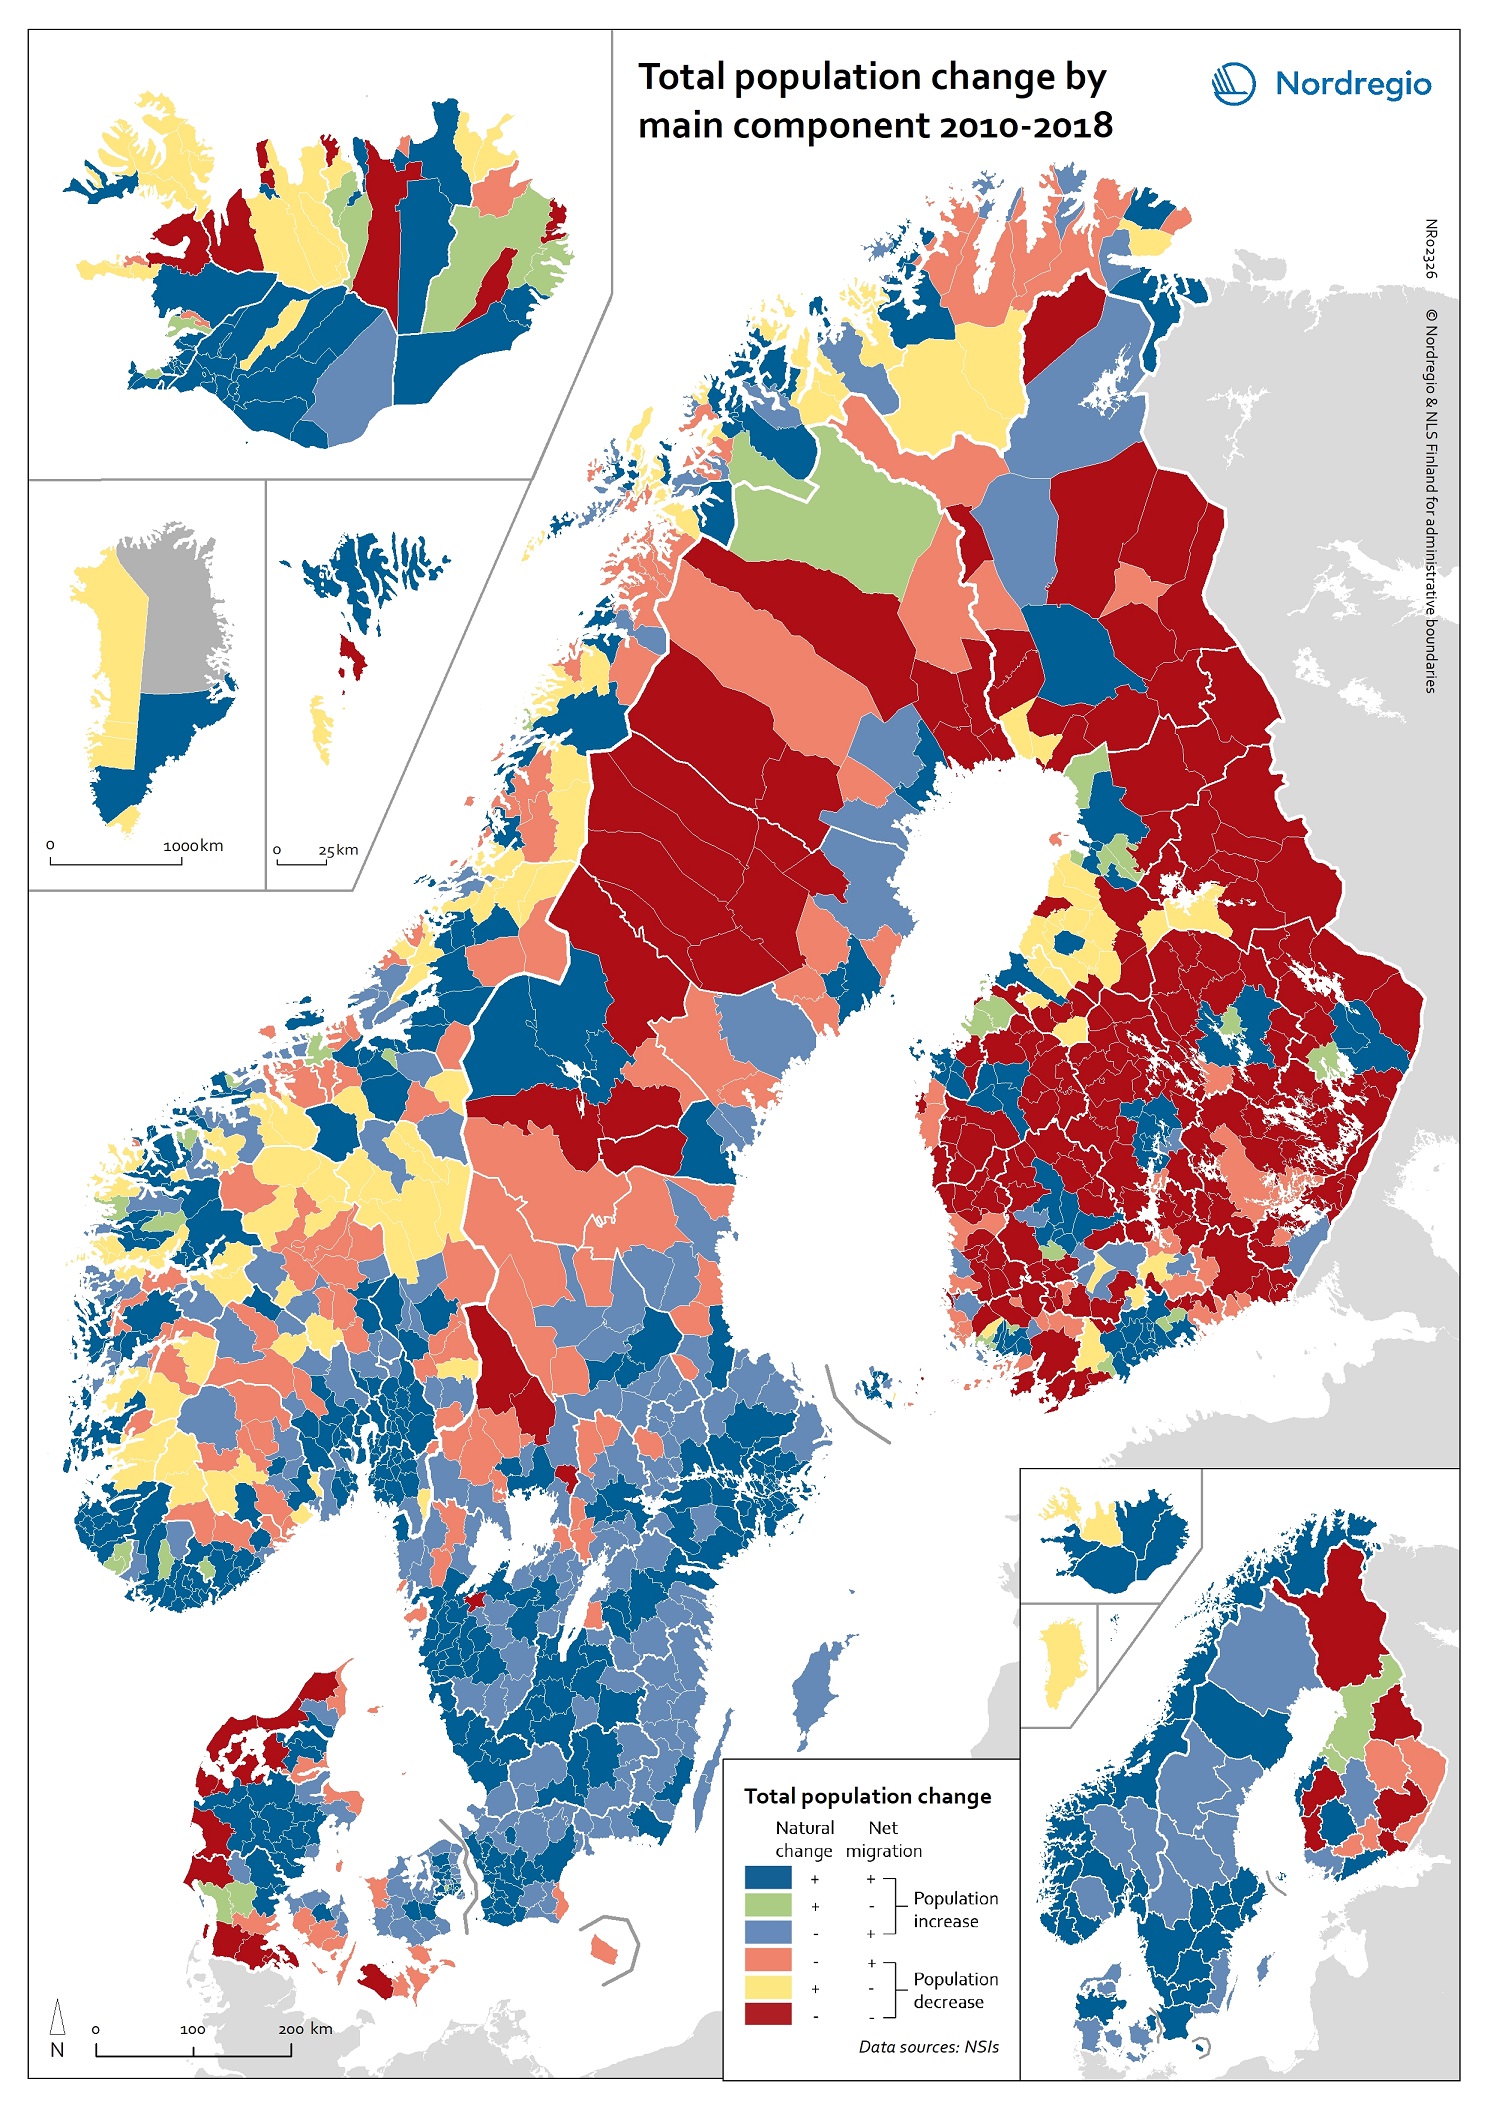
Total population change by main component 2010-2018
This map shows total population change by main component at the municipal and regional level in 2010-2018. The two components of population change are natural change and net migration. As the map shows, all regions in Denmark, Norway and Sweden experienced population increase due to either a combination of natural increase and net migration or through net migration alone between 2010-2018. In Iceland, all regions experienced both positive natural increase and positive net migration, except for Vestfirðir and Norðurland vestra, which experienced population decline despite experiencing more births than deaths over the period. The regional picture in Finland was more varied, with population decline most pronounced in the east and the north. At the municipal level, the highest overall population growth can be found mostly in the capital regions and bigger cities (e.g. Tampere and Turku in Finland), Central Jutland (Denmark), coastal areas of Norway, southern Iceland, southern Sweden, the northern municipalities of the Faroe Islands and Sermersooq Municipality (Greenland), which contains the capital of Nuuk. The highest overall population decline can be found mostly in the western and southern parts of Denmark, the majority of Finnish municipalities and most inland municipalities in northern Sweden. While the map shows a snapshot of population change for one decade, these trends of population increase in urban regions and municipalities and decline and ageing in periphery regions and municipalities have been underway for some time and are expected to continue into the foreseeable future. Read the digital publication here.
- 2020 February
- Demography
- Migration
- Nordic Region
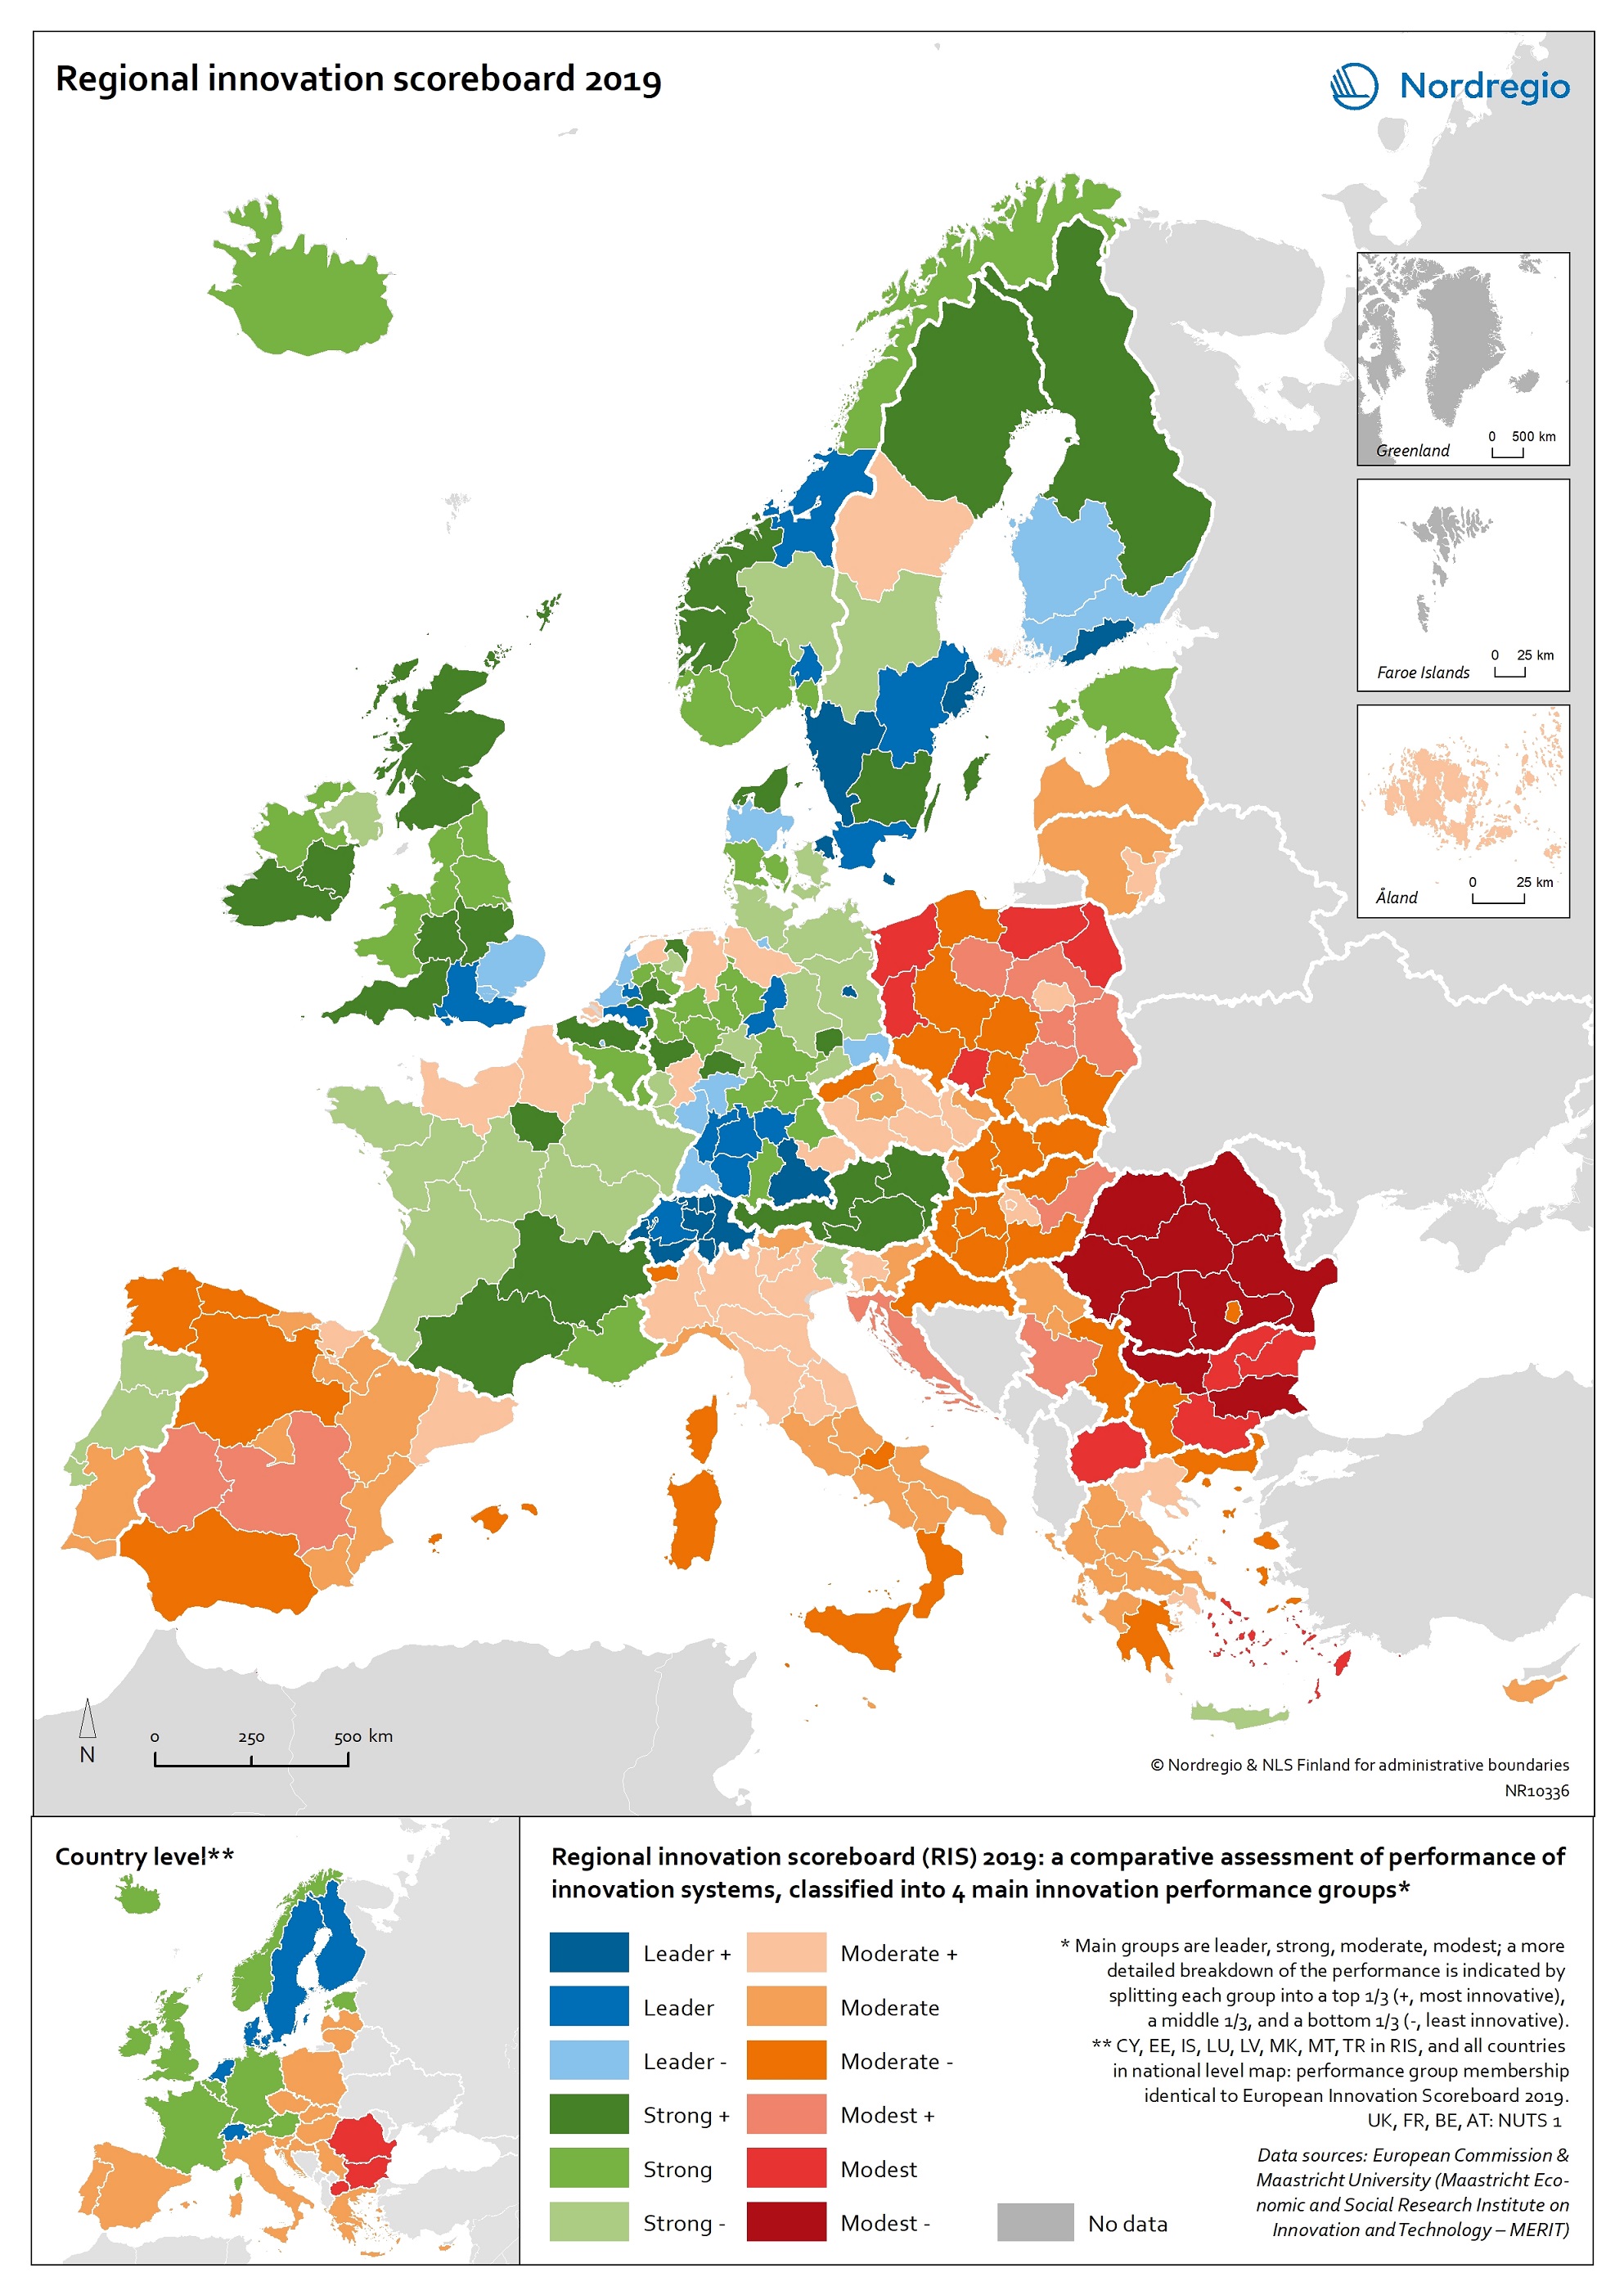
Regional innovation scoreboard 2019
This map shows the regional innovation scoreboard (RIS) in the European regions in 2019. The small map shows the innovation scoreboard at national level. The index shows the performance of innovation systems, classified into four main performance groups (leader, strong, moderate and modest). The European innovation scoreboard provides a comparative assessment of the research and innovation performance in European countries. It assesses the relative strengths and weaknesses of national innovation systems and helps countries identify areas they need to address. The Regional innovation scoreboard (RIS), a regional extension of the European innovation scoreboard, assesses the innovation performance of European regions on a limited number of indicators. The RIS 2019 covers 238 regions across 23 EU countries, as well as Norway, Serbia and Switzerland. Cyprus, Estonia, Latvia, Luxembourg and Malta are also included at country level. The RIS 2019 is a comparative assessment of regional innovation based on the European innovation scoreboard methodology, using 18 of the latter’s 27 indicators. It provides a more detailed breakdown of the performance groups with contextual data that can be used to analyse and compare structural economic, business and socio-demographic differences between regions. The Nordic regions are doing well in an overall RIS comparison regarding innovation performance. There are, however, considerable differences in innovation performance between the Nordic regions. For example, the capital regions have higher levels of innovation performance than more rural and peripheral regions, according to RIS 2019. This is often due to the critical mass of companies and the spatial significance of the proximity of firms and entrepreneurs, enabling knowledge-sharing and spill-over effects. Read the digital publication here.
- 2020 February
- Economy
- Europe
- Research and innovation
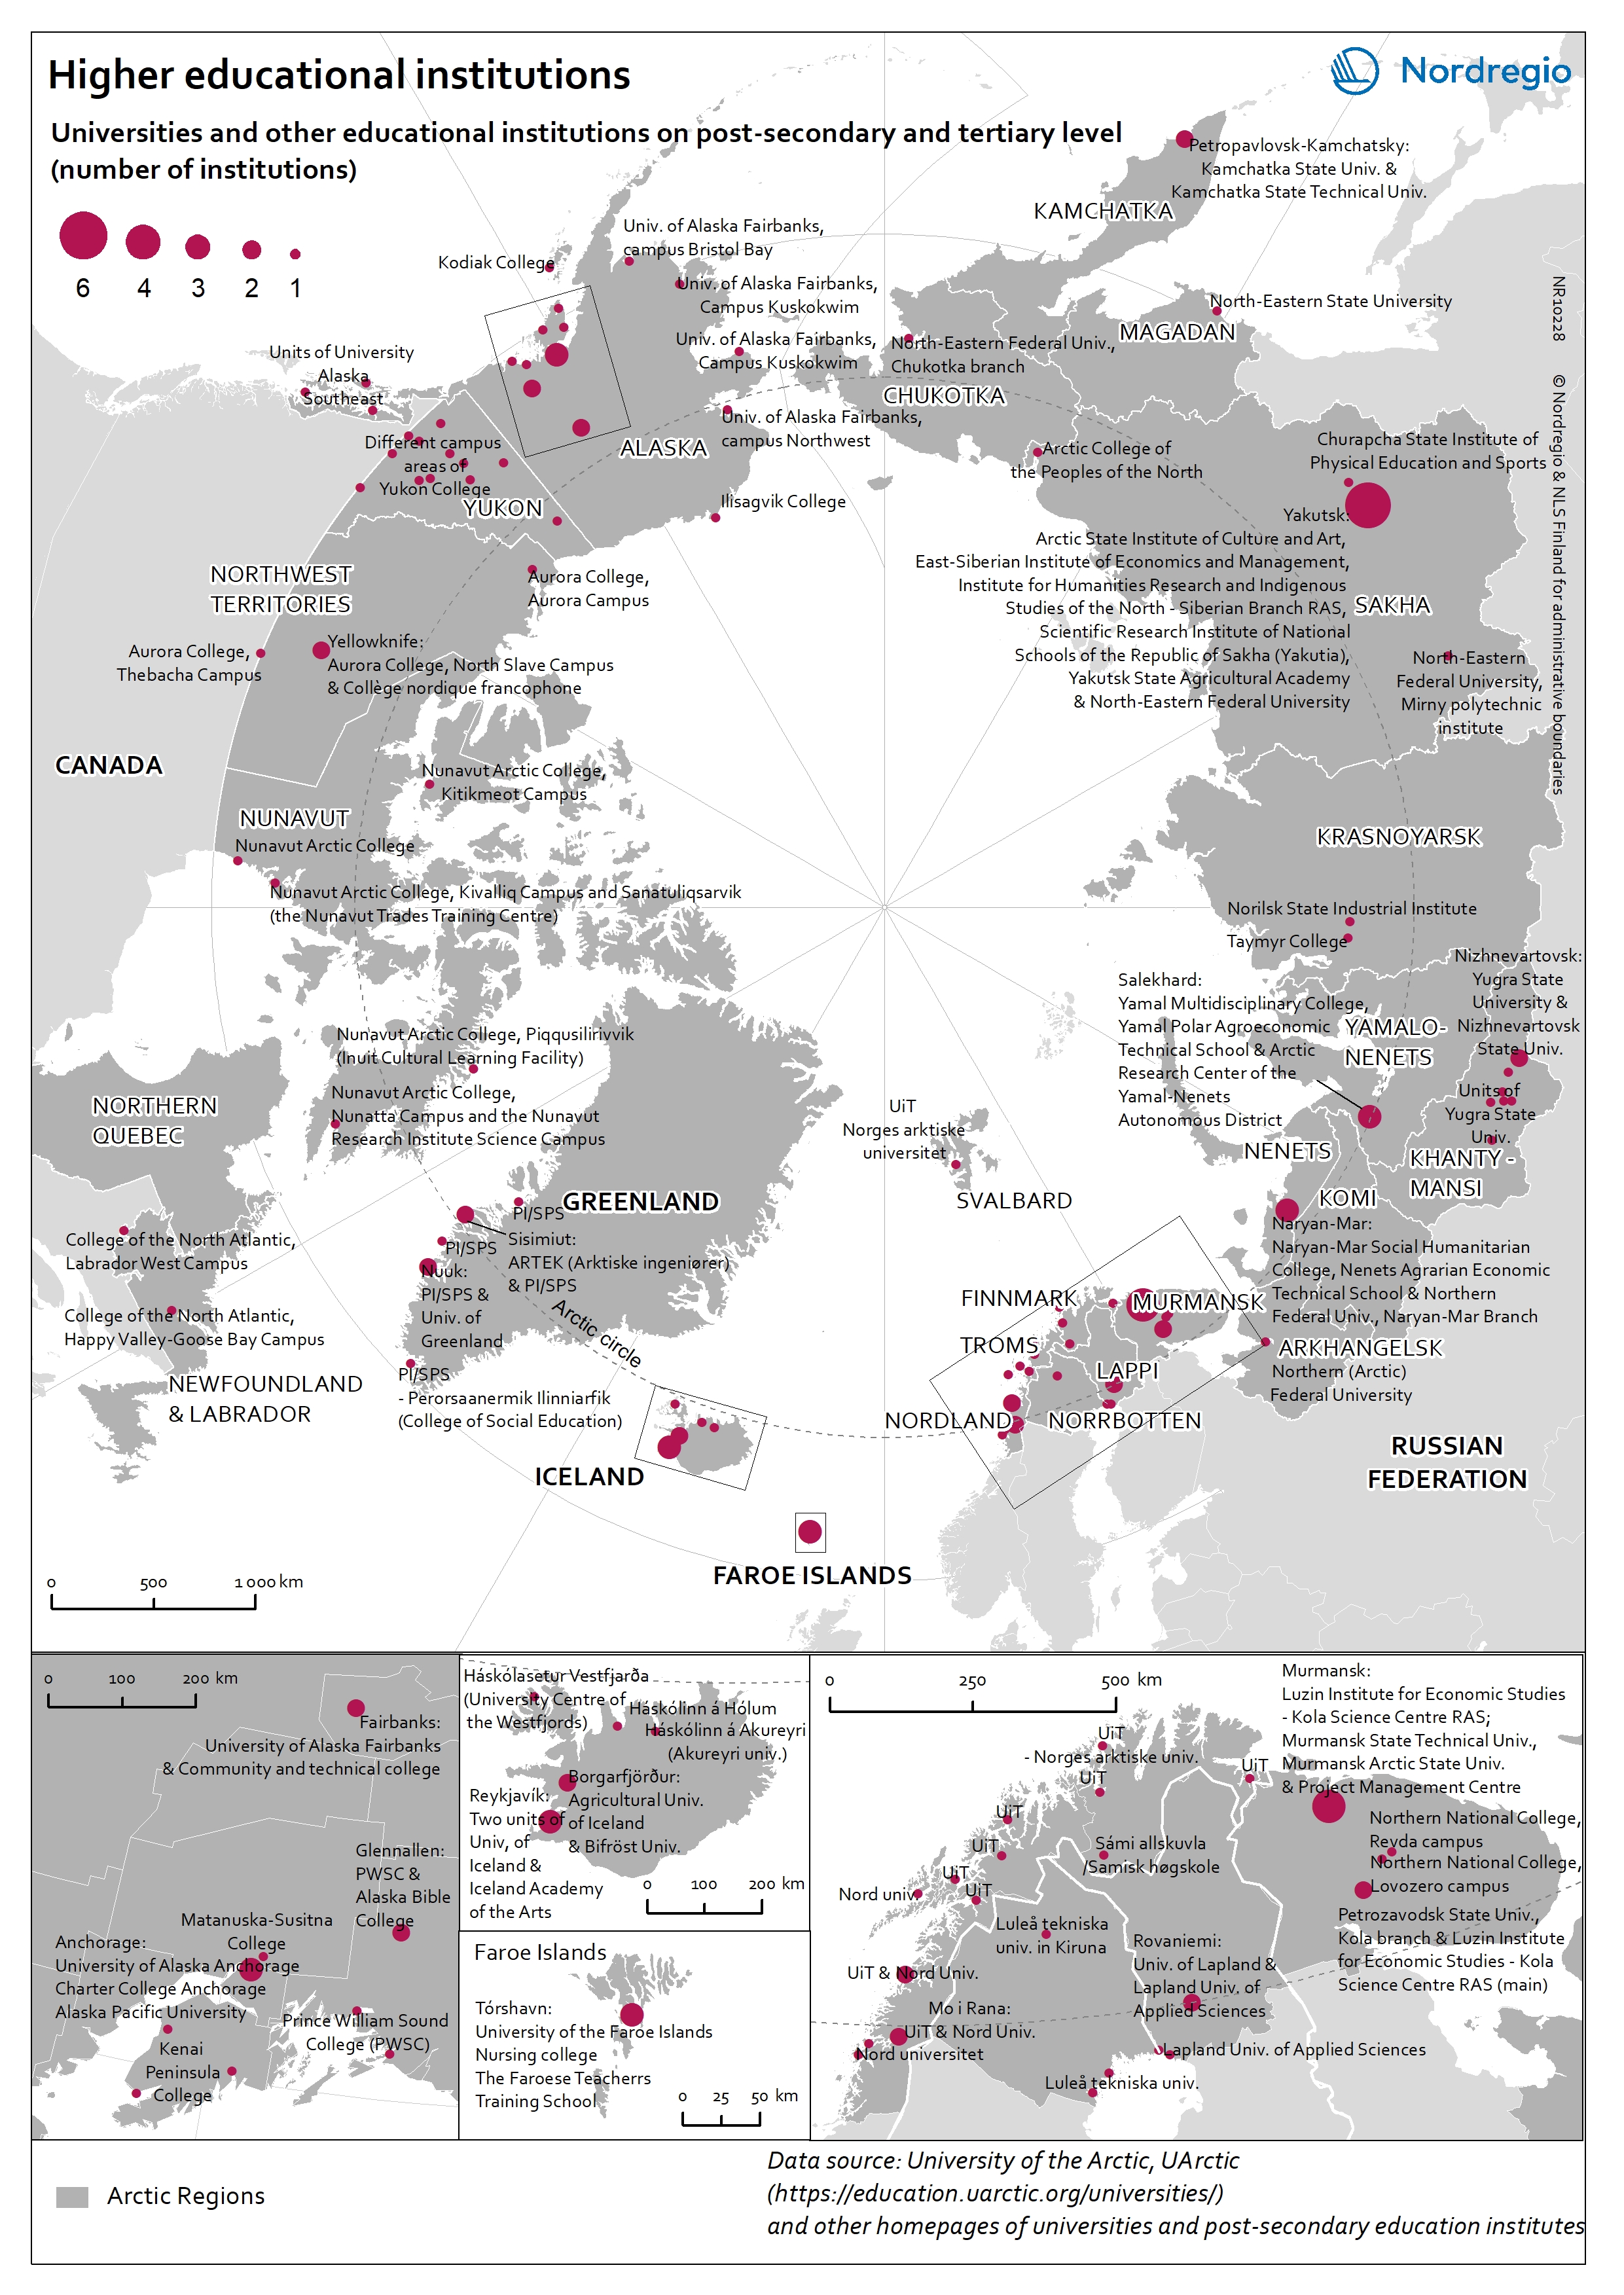
Higher educational institutions in the Arctic
The map shows universities and other educational institutions on post-secondary and tertiary level located in the Arctic. The red circles indicate a location of a university, college, or campus areas within the Arctic. The size of the circle corresponds to the number of educational institutions in a specific location. There is a high density of educational education institutions around Anchorage (Alaska), in Iceland, the Faroe Islands and the Arctic Fennoscandia (see zoom-in maps). In the Yukon (Canada), the Yukon College is the main educational institution, which has several campus areas across the region. In the Russian Arctic the largest centres with higher educational institutions are in Murmansk, Naryan-Mar (Nenets), Nizhnevartovsk (Khanty-Mansi), Salekhard (Yamalo-Nenets), and Yakutsk (Sakha).
- 2019 March
- Arctic
- Others
- Research and innovation
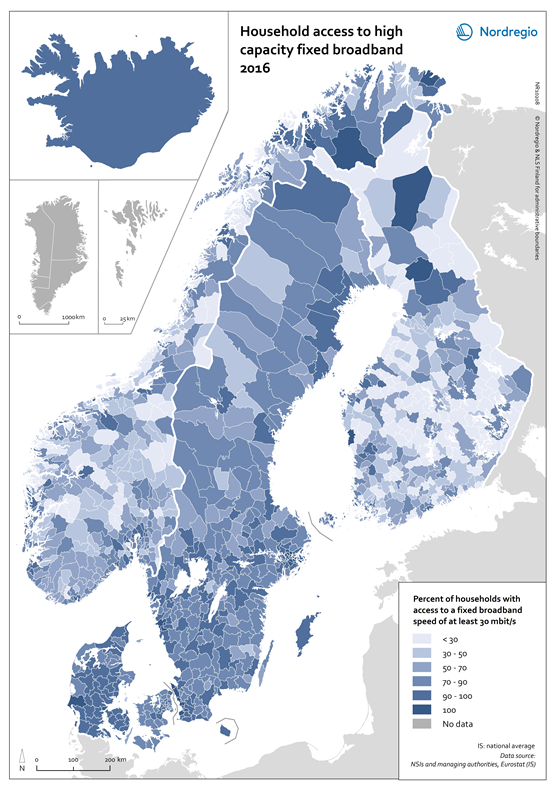
Household access to high capacity fixed broadband 2016
This map shows the household access to high capacity fixed broadband for all Nordic municipalities in 2016. The blue shading indicates the percentage of household with access to high capacity fixed broadband speed of at least 30 mbit/s in 2016. The darker the blue the larger the percentage of household with access to high capacity fixed broadband speed in the municipality, while the brightest colours represent municipalities with a low share. The grey colour indicate municipality with no data. High capacity fixed broadband coverage enhances access to digital solutions in both rural and urban contexts across the Nordic Region, thus making these areas good places to live, work and run a business domestically and across national borders. At a municipal level the household coverage by high capacity fixed broadband shows a more varied picture than that at the regional level. The average figure for Nordic municipalities was 63% in 2016, with more homogeneous figures in Denmark and Sweden than in Norway and Finland. The variation between neighbouring municipalities reflects the decision at the municipal level to prioritise investments in broadband infrastructure development as well as the nurturing of a favourable climate for the establishment of data centres requiring fast broadband networks, among other things. Fifteen Nordic municipalities, located in Sweden and Norway, had already reached the 100% mark for household coverage by high capacity fixed broadband in 2016. In Sweden, these municipalities are located in both the capital city region and in Skåne. In Norway, they are found in the more remote and rural parts of Møre og Romsdal (e.g. Giske), Troms (i.e. Lavangen) and Finnmark regions (Båtsfjord). Municipalities having values above 90% are mostly located in capital city regions as well as in more rural contexts in Jylland (Denmark), southern Sweden and northern Finland and Norway. One explanation for…
- 2018 February
- Nordic Region
- Others
- Research and innovation
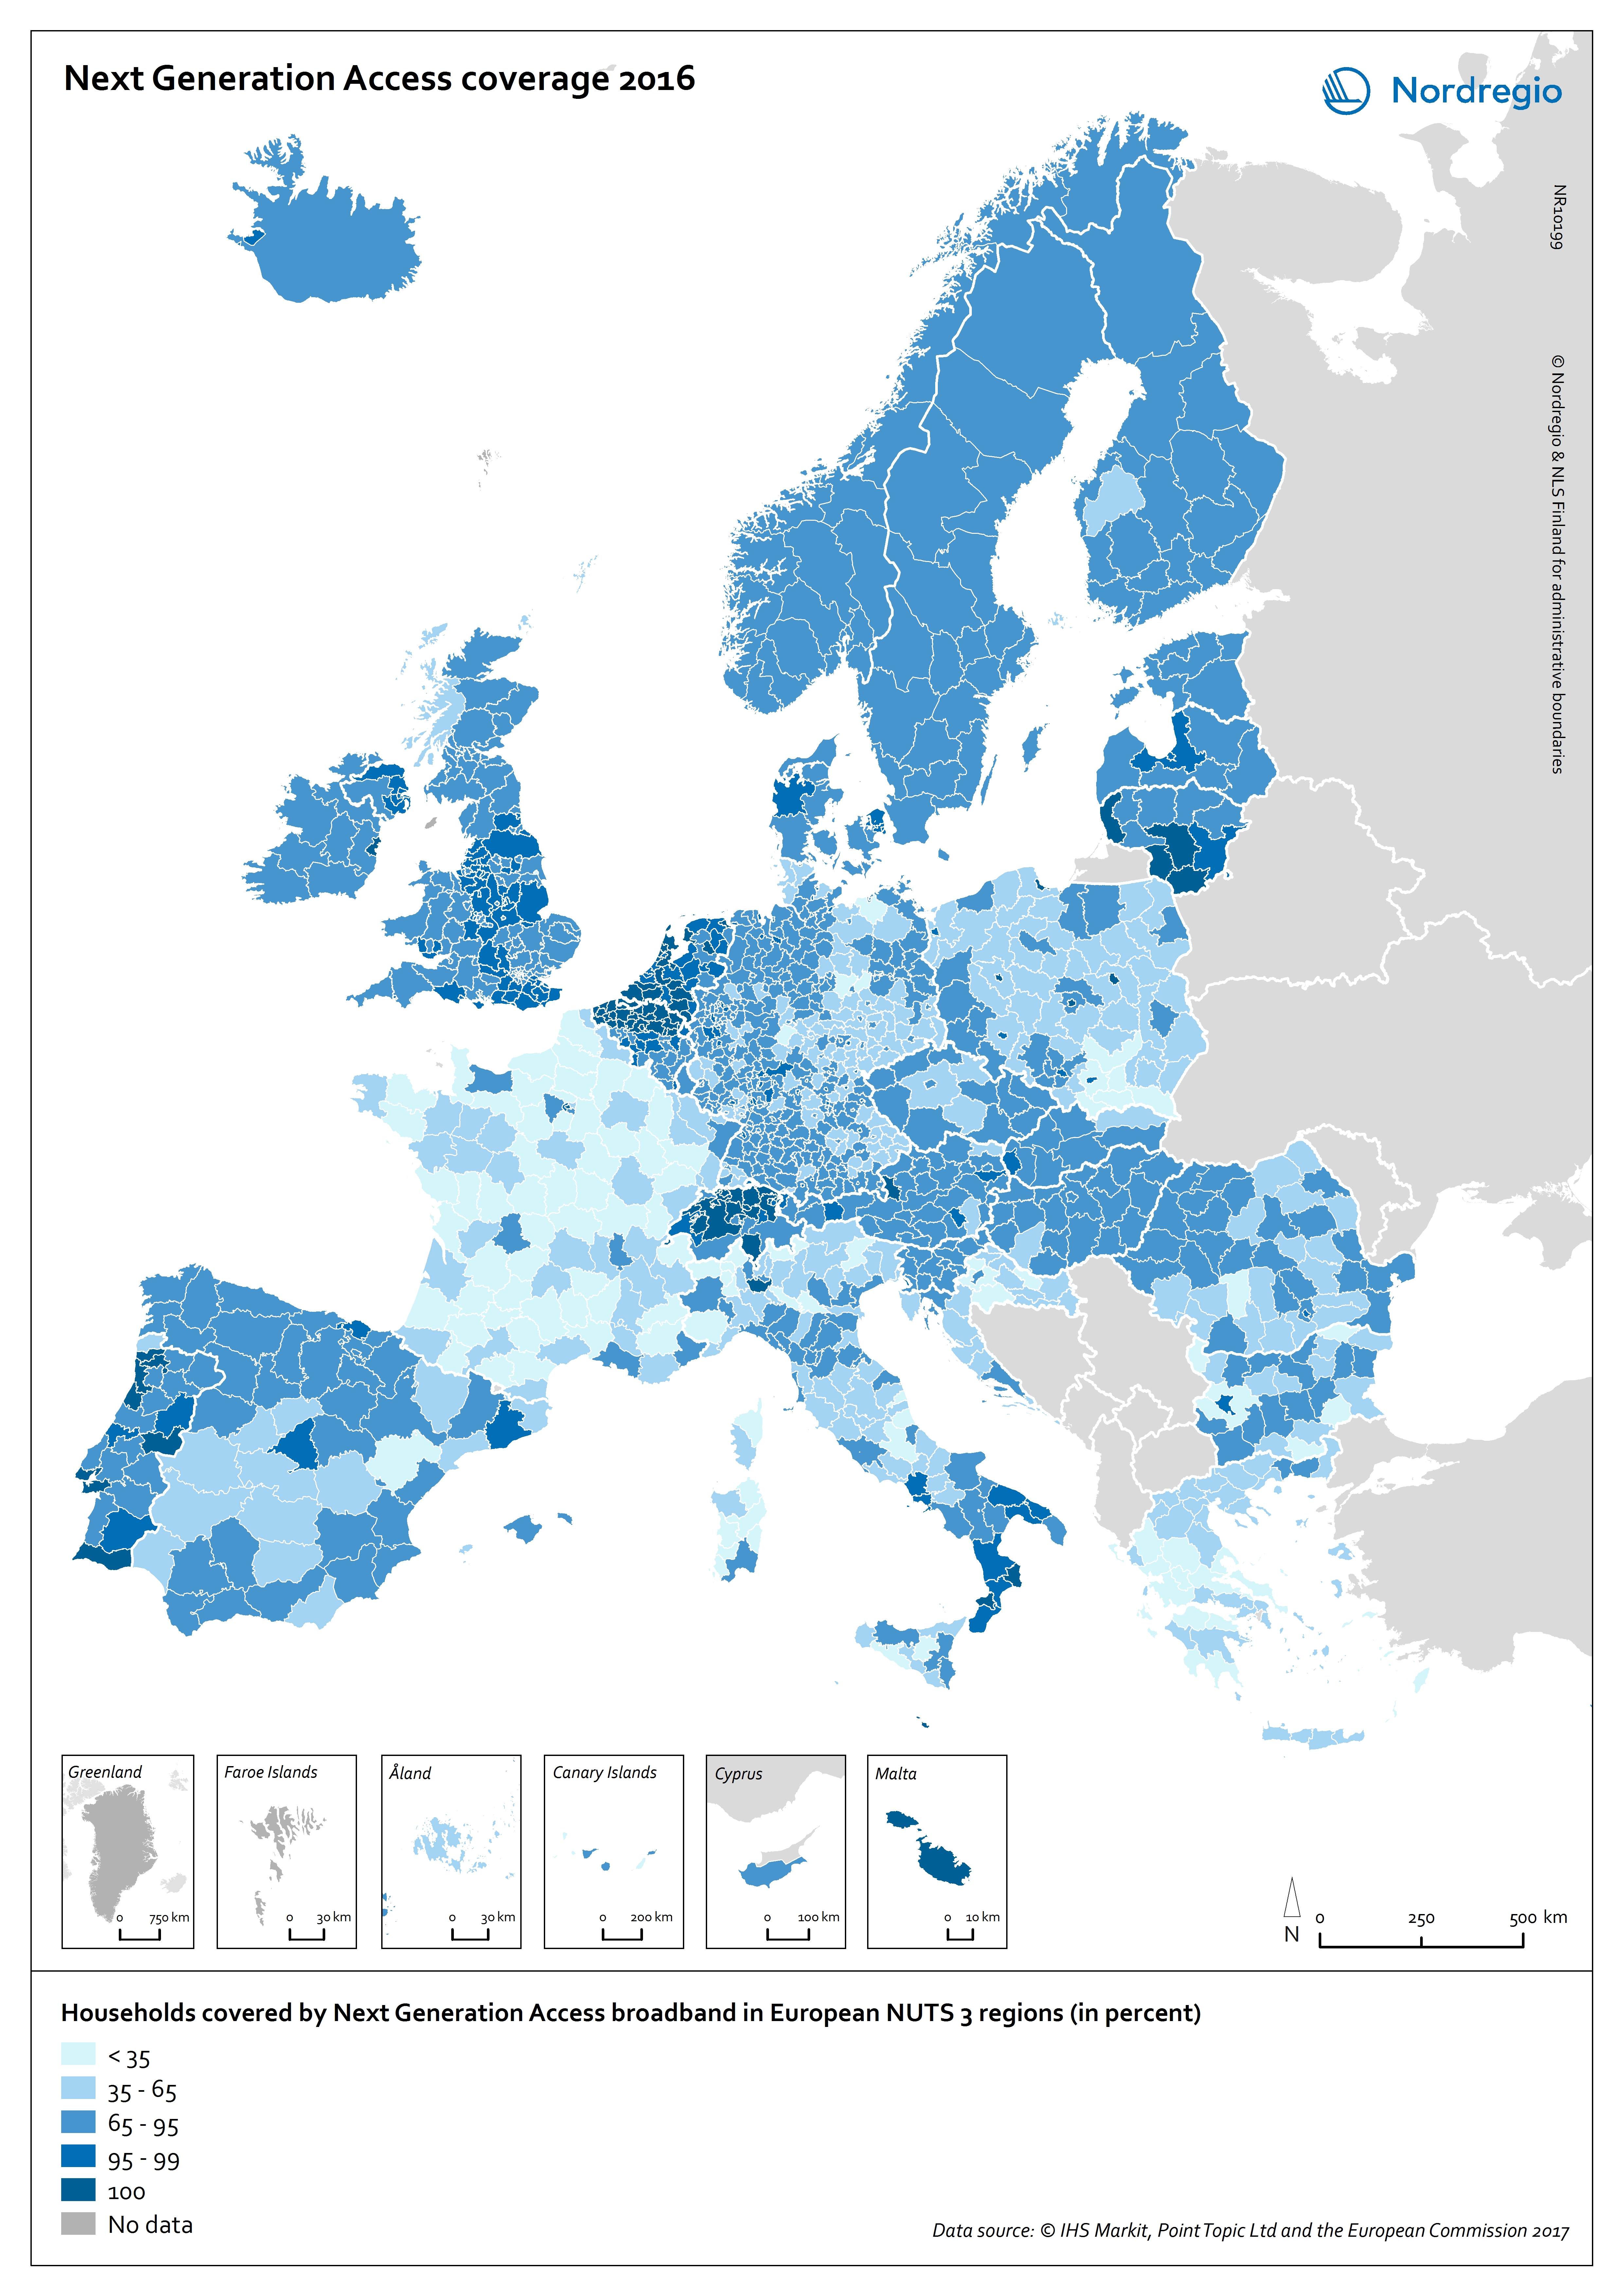
Next Generation Access coverage 2016
This map shows the Next Generation Access (NGA) network coverage in European regions in 2016. The blue shading indicates the percentage of household covered by NGA broadband in European NUTS 3 regions. The darker the blue the larger the percentage of household covered by NGA broadband in the region, while the brightest colours represent regions with a low share. Regions with relatively small territories and important population densities stand out in terms of high NGA network coverage, e.g. urban regions in the Netherlands and Switzerland. Capital city regions also have high NGA network coverage scores, while the more rural regions continue to lag, e.g. in parts of France and Poland. The Nordic countries are characterised by having almost no differences within their territories, i.e. no large variation in terms of NGA network coverage, unlike the clear regional differences in countries such as France or Italy. All regions in the Nordic countries score in the range of 65% to 95% of households having NGA network coverage, except for Etelä-Pohjanmaa in Finland which has a coverage range of 35% to 65% and the Danish statistical region of Østjylland and the capital regions of Denmark and Iceland with scores between 95% and 100% respectively. The relatively high figures for the Nordic Region can in part be explained by the existence of national and regional digitalisation strategies over the last decade or so. In Denmark, as well as in the other Nordic countries, digitalisation has long been on the national agenda. One of the main goals of these strategies has been to increase the growth and productivity of the business community – and to make it easier and cheaper to establish digital infrastructure. The regional level has an important role to play in the development of digital infrastructure, hence the relevance of the elaboration…
- 2018 February
- Europe
- Others
- Research and innovation
